Can you also advise with what webbrowser setting in the https://server.growatt.com/ you link this minimum and maximum battery capacity?
For some reason it did change after all, but strange enough I checked it a few times, even with an hour in between, now I was travelling and got back home and I see it set to 15% which I send from homey the day before yesterday.
I remember shinelink does not actively pull latest state of the settings. maybe it syncs it once a day or so.
Correct, but the web UI has a READ function, I use this to force parameter updates. Not without errors but after the need to read multiple times it is ok.
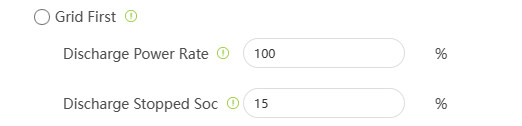
I’ve had strange experiences since 2 days on the TL-XH, the AC charge does not function anymore. I discovered that the Charging Power Rate was set to 100% (which is default). Changing this to 50 and back to 99 the AC charge was reactivated.
As you know the time slots are required to activate prio battery to be able to AC charge. It seems that we need to add another option [Charging Power Rate] percentage 0 ~ 100%. Unfortunately I cannot find the parm in the MTU list, Growatt_Modbus RTU Protocol MAX Series_v124_2023.pdf
Hi @Edwin_Biemond,
I’m trying my luck here ![]()
Is there a way to make this work with the SunGrow inverter?
They use the iSolarCloud app. I wrote to the support team and they responded that they work only via a MODBUS-protocol no API to connect to third party apps. I hope that is sule useful info. Happy to provide you with more info if needed!
Thanks for the tip @Ria_Banis
Thank you!
Tim
if you have some doc with the registers and can give me temp vpn access. it should be doable. mostly reading will be quick, changing depends how complicated they made it.

I reported this some while ago on github. Not sure if it is an App or Homey problem.

Hey Sjaak, I am also trying to get the power control function working on my Solar Edge using Loxone as a controller. Would you mind sharing your insights? Cheers, Marc

hi Sjaak, thanks for your example. I see I was already well on my way. What I don’t really understand yet is the difference between active and reactive steering. I see you also use advanced power control. Is it not sufficient to actively manage everyone? And it might be useful to connect Loxone’s load manager via an analogue scaler to scale the range of your kilowatt peak power to 0 to 100%. Then you can control your production based on the required power in the installation, with of course a margin + or a margin -.
But many thanks for the efforts. Lovely!
Hi Marc, connecting the load manager does not benefit me due to the way we are billed here in the Netherlands. It only benefits me to turn off the power when the net price is negative. In the future when the energy market changes, then this is something I will certainly implement.
Not sure what you mean by actively manage everyone?
Just want to say thank you - again - for this great app! Together with the also great app Power by the Hour by @Gruijter I’m able to perfectly control the charging- and discharging behaviour of my PV battery to get the most out of my system.
The chart below shows the completely automised charging/discharging strategy for the next days:
- green - control just according the current electricity prices
- yellow - prevent discharging
- orange - prioritise battery charging over self consumption
- red - charge from grid

Not yet perfect, but I’m quite happy with it. Thanks to everyone who made this possible!
Hi,
Your controls are similar to mine however one question: How do you generate such a nice chart, is this auto-output or manual excel or something?
Thanks,
I used the inspiration from @Stikstof to create a link to image-charts.com. Very handy for visualisation.
Thanks, I’ve studied the info. Nice idd. The charts I see in the posts are basic, in fact the power to the hour has a chart like that, yours on the other hand is much nicer. Thing is, not inventing the wheel for 2nd time, how do you play with the vars used in your chart, how are the transferred, all in your script? Do you wanna share any of this?
For what it’s worth, I’m not lazy but need some kind of start-help with this.
Thanks,
It’s pretty much the same with just some minor adjustments. Below is my code - pretty straight forward, no magic there:
function buildChartUrl(simulatedHours)
{
	// Set base url
	const chartWidth = 1200;
	const chartHeight = 600;
	const baseUrl = `https://image-charts.com/chart.js/2.8.0?bkg=white&height=${chartHeight}&width=${chartWidth}&c=`;


	let values=[],labels=[],backgrounds=[],datalabels=[];
	lastSimulatedSOC=-1;
	for (i=0;i<simulatedHours.length;i++)
	{
		hour=simulatedHours[i];
		values.push(hour.price);
		labels.push(((currentHour+i)%24).toFixed(0).padStart(2,"0"));

		simulatedSOC=Math.round(100.0*hour.simulatedBatteryAtEnd/batteryCapacity);
		if (simulatedSOC!=lastSimulatedSOC) datalabels.push(simulatedSOC.toFixed(0)+"%");
		else datalabels.push([]);
		lastSimulatedSOC=simulatedSOC;

		let color;
		if (hour.chargingMode==CHARGING_GRID) color="rgb(255,0,0)";
		else if (hour.chargingMode==CHARGING_PRIORITISE) color="rgb(255,160,0)";
		else if (hour.dischargingMode==DISCHARGING_OFF) color="rgb(255,255,0)";
		else if (hour.pvYield>=hour.consumption) color="rgb(192,255,64)";
		else color="rgb(0,255,0)";
		backgrounds.push(color);
	}


	// Build configuration for the chart
	const settings=
	{
		type: "bar",
		data:
		{
			labels,
			datasets: [
				{
					label: "Optimierung",
					backgroundColor: backgrounds,
					data: values
				}
			]
		},
		options:
		{
			responsive: true,
			legend: { position: "none" },
			layout:
			{
				padding:
				{
					top: 35,
					bottom: 0,
					left: 5,
					right: 5
				}
			},
			rectangleRadius: 6,
			plugins:
			{
				datalabels:
				{
					anchor: 'end',
					align: 'start',
					offset: -10,
					padding: 0,
					backgroundColor: 'white',
					color: 'black',
					font: { size: 7 }
				}
			},
			datalabels
		}
	}
MANY THANKS!
Will go for a spin this week. I was very curious if you read the system data, it seems that you are using the Power By The Hour data to display what the system should do, but not how the system is configured to deal with the data, but this is my first look to the script.
Have to see what my set will tell me compared to what I’ve automated.
Thanks again!
Will go for a spin this week. I was very curious if you read the system data, it seems that you are using the Power By The Hour data to display what the system should do, but not how the system is configured to deal with the data, but this is my first look to the script.
Not sure I understand you right. The chart is the visualization of the actual charging/discharging strategy for the next few hours, i.e. the battery is controlled in the way that is shown in the chart. The optimization strategy is determined and updated every five minutes based on current data (mostly batter level) and expected data (yield and consumption, mostly based on historic values).
The script that determines the strategy is far from finished and right now optimized for saving the battery for the expensive hours. Currently I’m working on extending it to prevent the battery being full at very cheap hours, i.e. when grid charging would be favourable. I might create a Homey app based on it when it’s finished.
