
Selecting a Better Logic Insights var as action card:

Awesome app! I’m using this to switch the extraction fan as @Peter_Kawa. Just trying to find the right trend to prevent it frome turning off whilst cooking.
But I also like to switch my mechanical ventilation based on co2. Sure WHEN higher than x THEN set fan off/low/high works, but it takes a while to lower co2 when it’s raisen.
So with trends I could switch it to high when it rises quick (visitors over) to start ventilating soner.
I feed the calculation every minute with co2 ppm. Every 15 minutes the calculion should be completed. But the trend values are through the roof. 4.0-22.0. Shouldn’t it always be between 1and - 1?
[10-05 22:08] .: https://homey.app/f/y9mVnBq
[10-05 22:09] .: https://homey.app/f/mxrVnB

Hi Fabian,
The first flow link shouldn’t have the last ‘q’  But I was able to view it.
To calculate the c02 ppm every minute is ok, but you can change it to every 10secs or something. The developer tested the calculations, it generates very little load on Homey. The more measure points, the more accurate it works.
About the “every 15 mins the calculation should be completed”, it works a little different.
The 15 minutes setting means, it calculates the trend of the c02 ppm values of the last 15 minutes. But maybe you meant that.
The calculation itself is done in a sec or so.
About your returned trend numbers,
the app description indeed says:
- Trend: a value between -1 and 1 indicating if the sensors measurement is going up or down (and how fast/slow). for example a value of 0.75 means the trend is going up rapidly while -0.1 means a slight downwards trend
So the trend should be between -1 and 1, but it isn’t.
If a trend is 22, it just means the measured value has raised very very fast in time.
I don’t think anything is wrong with the trend numbers you receive.
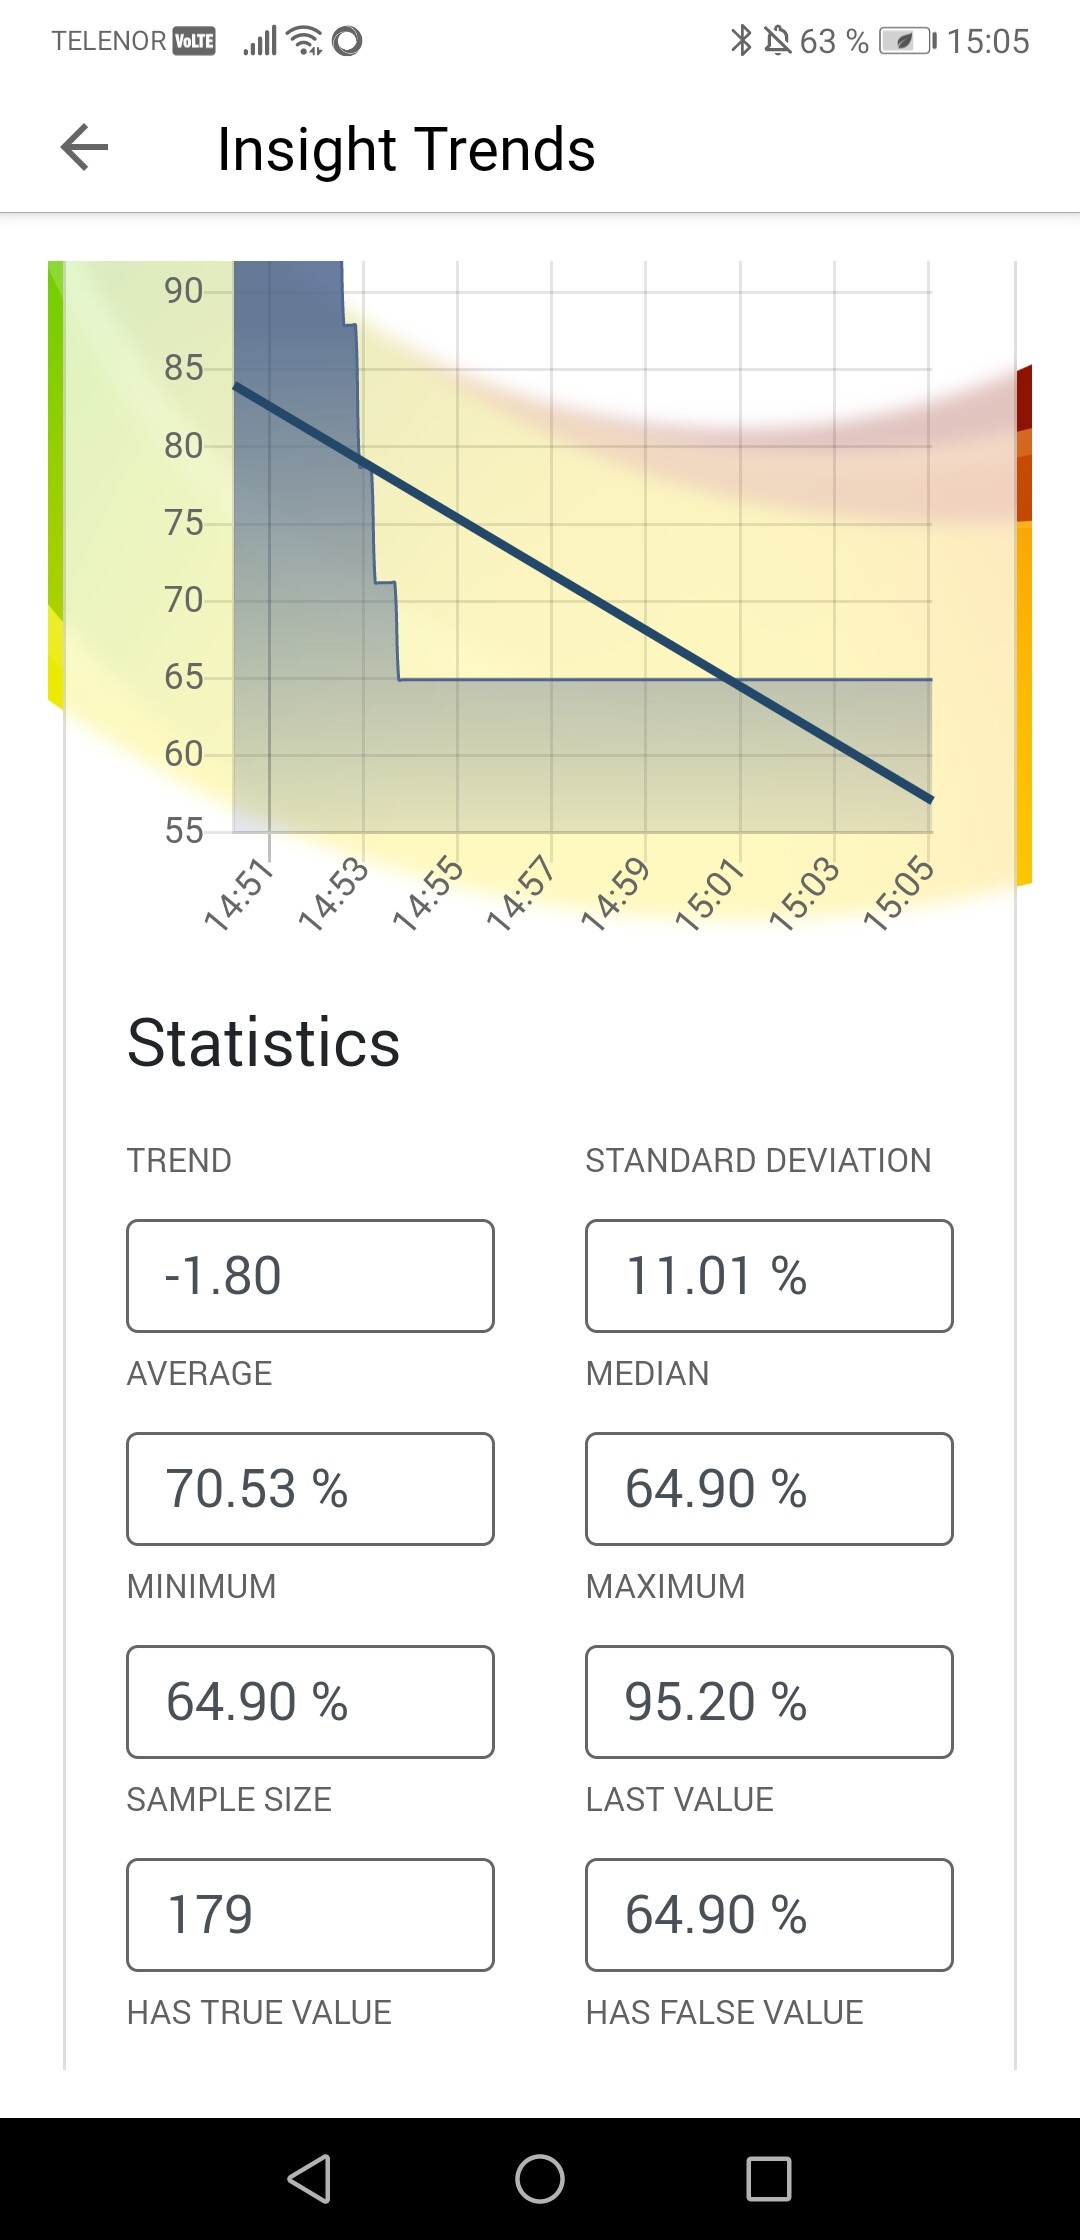
So I ran a test, and I can confirm a trend of -7.99 which shutted down my cooker hood:

To ‘sanitize’ your trend values, you can do this inside your notification card: Trend={{round([trendtag],2)}} to display the trend with 2 digits.
Didn’t find an answer above…
Is it possible to apply any other trend than a linear one?
And another question, or rather feature suggestion: How about adding the possibility to add a summarizer over a period of time? Kind of like the app “Power by the hour”, but for any insghts value. Many values will not mean anything relevant but others most certainly will.
That would for instance make sense for solar radiation weather station data. How much energy has been radiated between time x & y?


Afaik you should search for “insights” in the app store. There’s a few databases and tools, so you can run your own query’s on the stored data.
The native Insights data gets summarized (by average calculations) more when the timeframe gets larger.
F.i. the last hour there were 90 measured energy levels recorded.
If you look for the graph about the last week, there’s (I don’t know the exact) let’s say an average measure point for every hour.
Meaning, (by example):
90 mp’s per hour = 2160 mp’s per day = 15120 mp’s a week.
That’s brought back to 24*7=168 averaged mp’s.
All this to save storagespace.
To be clear, idk the calculations and the formula, but for exact numbers and calculations I think you should export your f.i. hourly Insights to a database.

Also interesting I think

This is the app I was looking for ![]() but,…
but,… ![]()
PROBLEM IS SOLVED: look at the bottum of this post.
I want to use the average of a light sensor (lux) for my sunscreen to go up or down. Now I use just two single measurements to define if it has to go up. But with the nice Dutch clouds it happened that these measurements are both on a moment that there is a small cloud before the sun. So an average measurement is a lot better.
So I made a flow to test it first. My normal value to act is 1600 lux. But making a flow didn’t work out. After testing I found out that the average value is a factor 10 smaller than in real.

I tested it with these two simple flows:
Calculate values for Light Sensor (lux) for last 5 minutes
When calculation is finished, sent Telegram message with AVG value
In the app configuration it shows the right values. @MadMonkey, is this an error in the app?
SOLVED: Found out that I used a different light sensors. I made the flow on my computer, when you choose a light sensor from the list (Licht Sensor), it takes the first one from the list instead (Aqara Motion Sensor). I found the problem when I looked at the flow on my phone.
See the short video/screen capture I made: Select Light Sensor in Insight Trends
Not a solution for your Q, but an alternative:
You could consider using the < group > app.
One sensor group device holds the value of the mean average of all included sensors.
You can create a sensor group, of the type ‘Luminance’ (‘helderheid’ in Dutch).
The available luminance sensors are presented and you can select your sensors of choice.
Then you’ll have a new ‘sensor’, showing the mean avarage lux value.
No flows needed. You can use this group sensor to trigger your flows, or use it as a condition.


Hi, thanks for a great app!
I have some trouble with trend calculation with a humidity sensor. It’s different values when I do the same calculation within the settings in the app, and when I do do it via flow. Same sensor, same scope: 15 min. Any idea?

I see that i can x100 the trend value, and it will be the same, but should it be like this?


I agree, sometimes I do not understand the results either. Just to speculate, is it possible that the “days” is calculated on last whole seven “days” (00.00-24.00)? Do you get correct Maximum if you set scope for a few hours?
This is actually an Athom optimization issue as they store less details for the past (which is good to save storage). So if you have a noicy signal and you check i.e the last 5 minutes you see the signal very detailed if you plot it. If you check a larger scope, i.e 7 days Homey uses an optimization alhorithm that stores only the ‘relevant’ recordings. As a result you’ll get a less detailled view with a smoothed curve.
In your example I would assume that your current reading is very different from what has been recorded in the last 7 days (or you only had spikrs which will be lost in that scope which might be fine by statistically ignoring them).
Personally I often use two scopes to analyse. I.e for checking the humidity I use a scope of 7 days to get a big picture and 6 hours scope to detect recent ups and downs
Thnx for your explanation. I was indeed thinking about the optimization of data. This result suggests there’s an different dataset for 7 days compared to, for example, 1 hour? I would expect this would be 1 dataset, with the most measures for last 1 hour and over time filtering (and deleting) some measures.
I’m using the insight trends for a diy rain gauge
Instead of writing the data in (a lot of) variables.
I’m using an “total rain” variable and calculating the hour, 23hour and 7 days rain.
(calculation of the period of time and distracting “max-min”)
I was aware of the optimization of homey of the dataset but didn’t expect it wouldn’t contain all the (detailed) data of the recent measures.
I might have to intergrate your suggestion of using 2 analyses. Thnx for the idea.
Actually I don’t know what algorithm Homey is using exactly. But from my experience this is not just a simple removal of certain entries but rather a complex optimization. There are algorithms that try to reduce the the measurements and still keep the same shape of the curve as much as possible. You can also see that a scope of 1 hour has much more samples than a scope of 7 days which is clearly a result of optimization.
Here is a pretty good example: Flot - Downsample Plugin (base.is)
I’m trying to send myself a notification of a calculated value, so I have the following flows:
- calculates trend Solar
- IF trend Solar calculated AND Average Solar > 1500w THEN send push message “solarpower [trend] to ‘me’”
I can’t get it to send the trend value. The avarage value is > 2000w a.t.m., but “trend” is the only Insights Trends tag I can find, but it reports ~0,57. When I look in the Insights Trend app page the “trend” is reported a 36,42.
So I can’t figure out what the value is that is reported by the Trend tag in the 2nd flow, or how I can report the calculated average value in the push message
I am not sure about this but when I use Trend it seems like the Insights settings Trend value is multiplied by 100. Does it make sense?
I experienced the same, but I could see that app was withdrawn from app store, and might be possible the latest bug added before removal  ? It is sad to see this app go, was very informative and easy to get insights from
  .
.
This is truly sad 
It have been some controversy between Athom and the developer earlier. Wonder if it is the developer or Athom who have withdrawn the app. I hope it not will happen with other useful apps because it will kill Homey Pro in the end.
