Reviewing insights is very helpful to check performance on my power usage.
Especially when combining my biggest power consumers in one graph and compare them with my solar power and hourly net pricing.
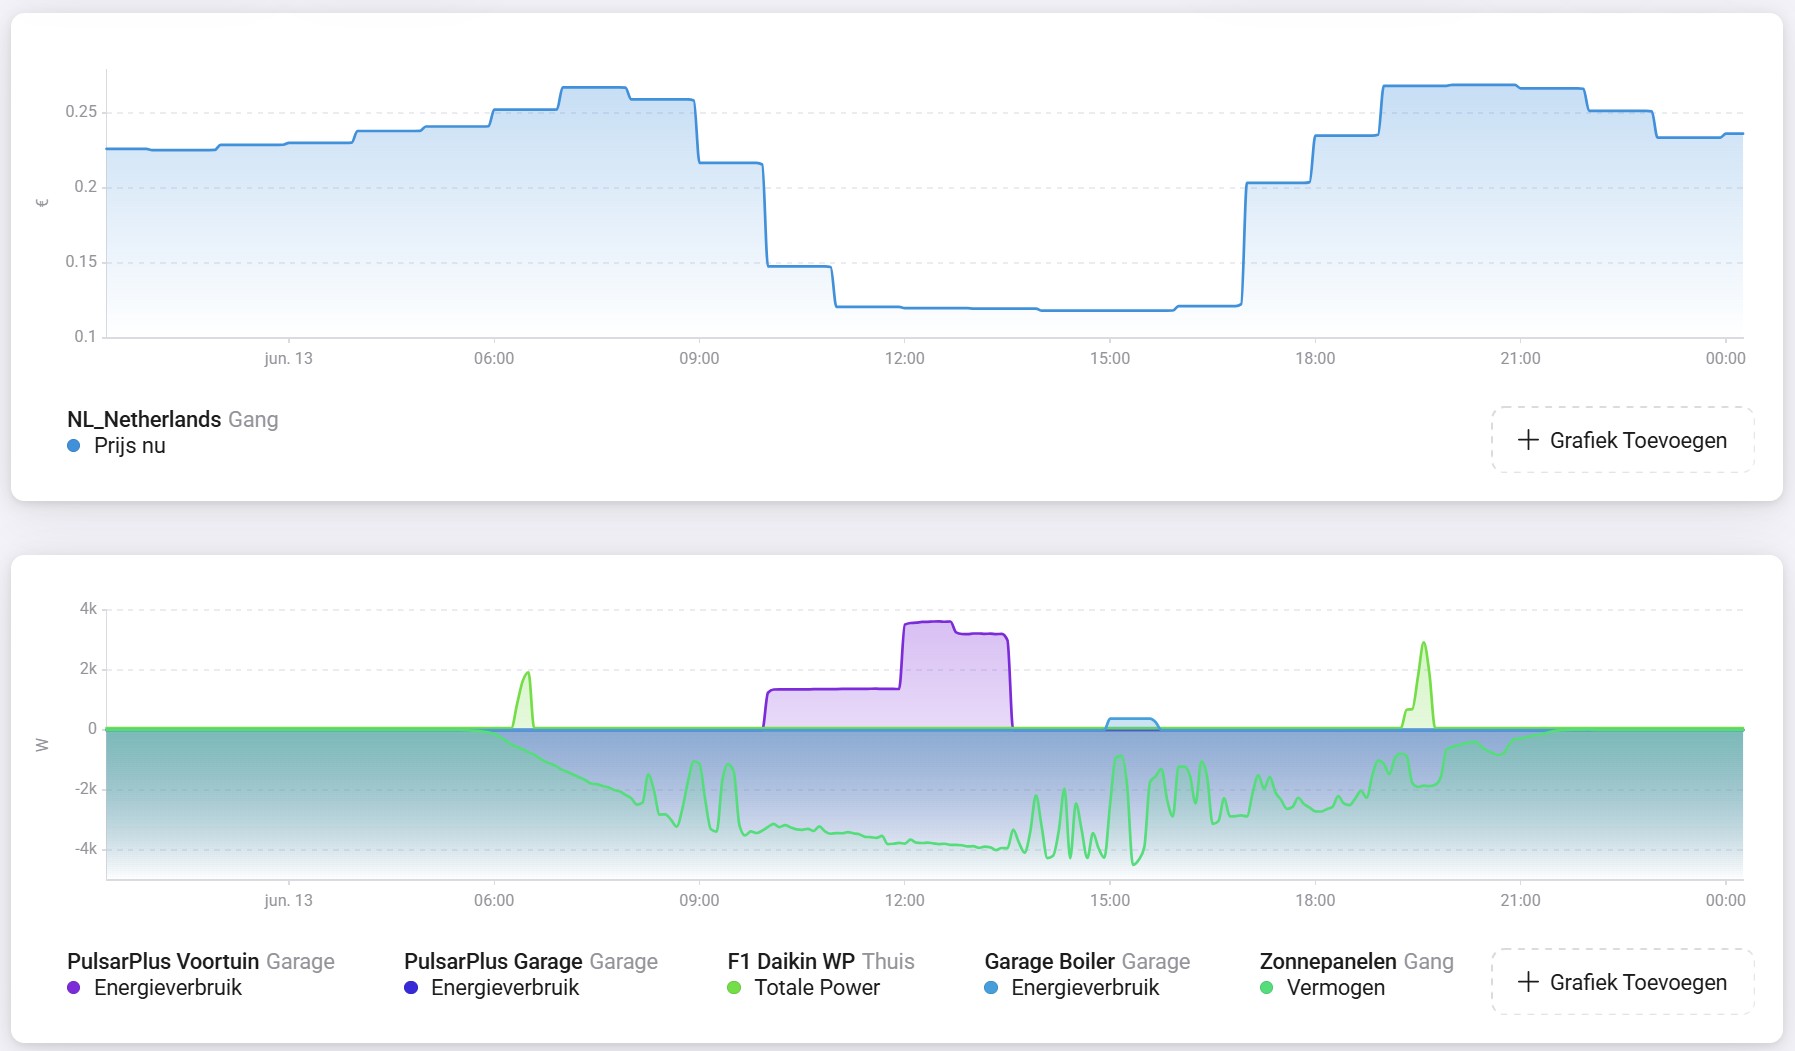
Right now it cost me a lot of effort to make these comparisons, and I want to check it daily to see how I am doing.
To have an oversight of hourly pricing for the whole day, I upload an snip from PBTH (power by the hour) to a server with the FTP Client.
On my Android phone I use Widgetify. It is not in the playstore anymore, but you can download the APK searching on google.
So this is my phones widgets which update every day.

On my wife’s iPhone I use Widget Web.
Now I want to create another phone widgets to display my Power insights.
Is there a possibility to create an image from a predefined insight graph, automatically in the background?
Or does anyone know of another solution to use the data from Homey to create this graph and convert it to an image?
