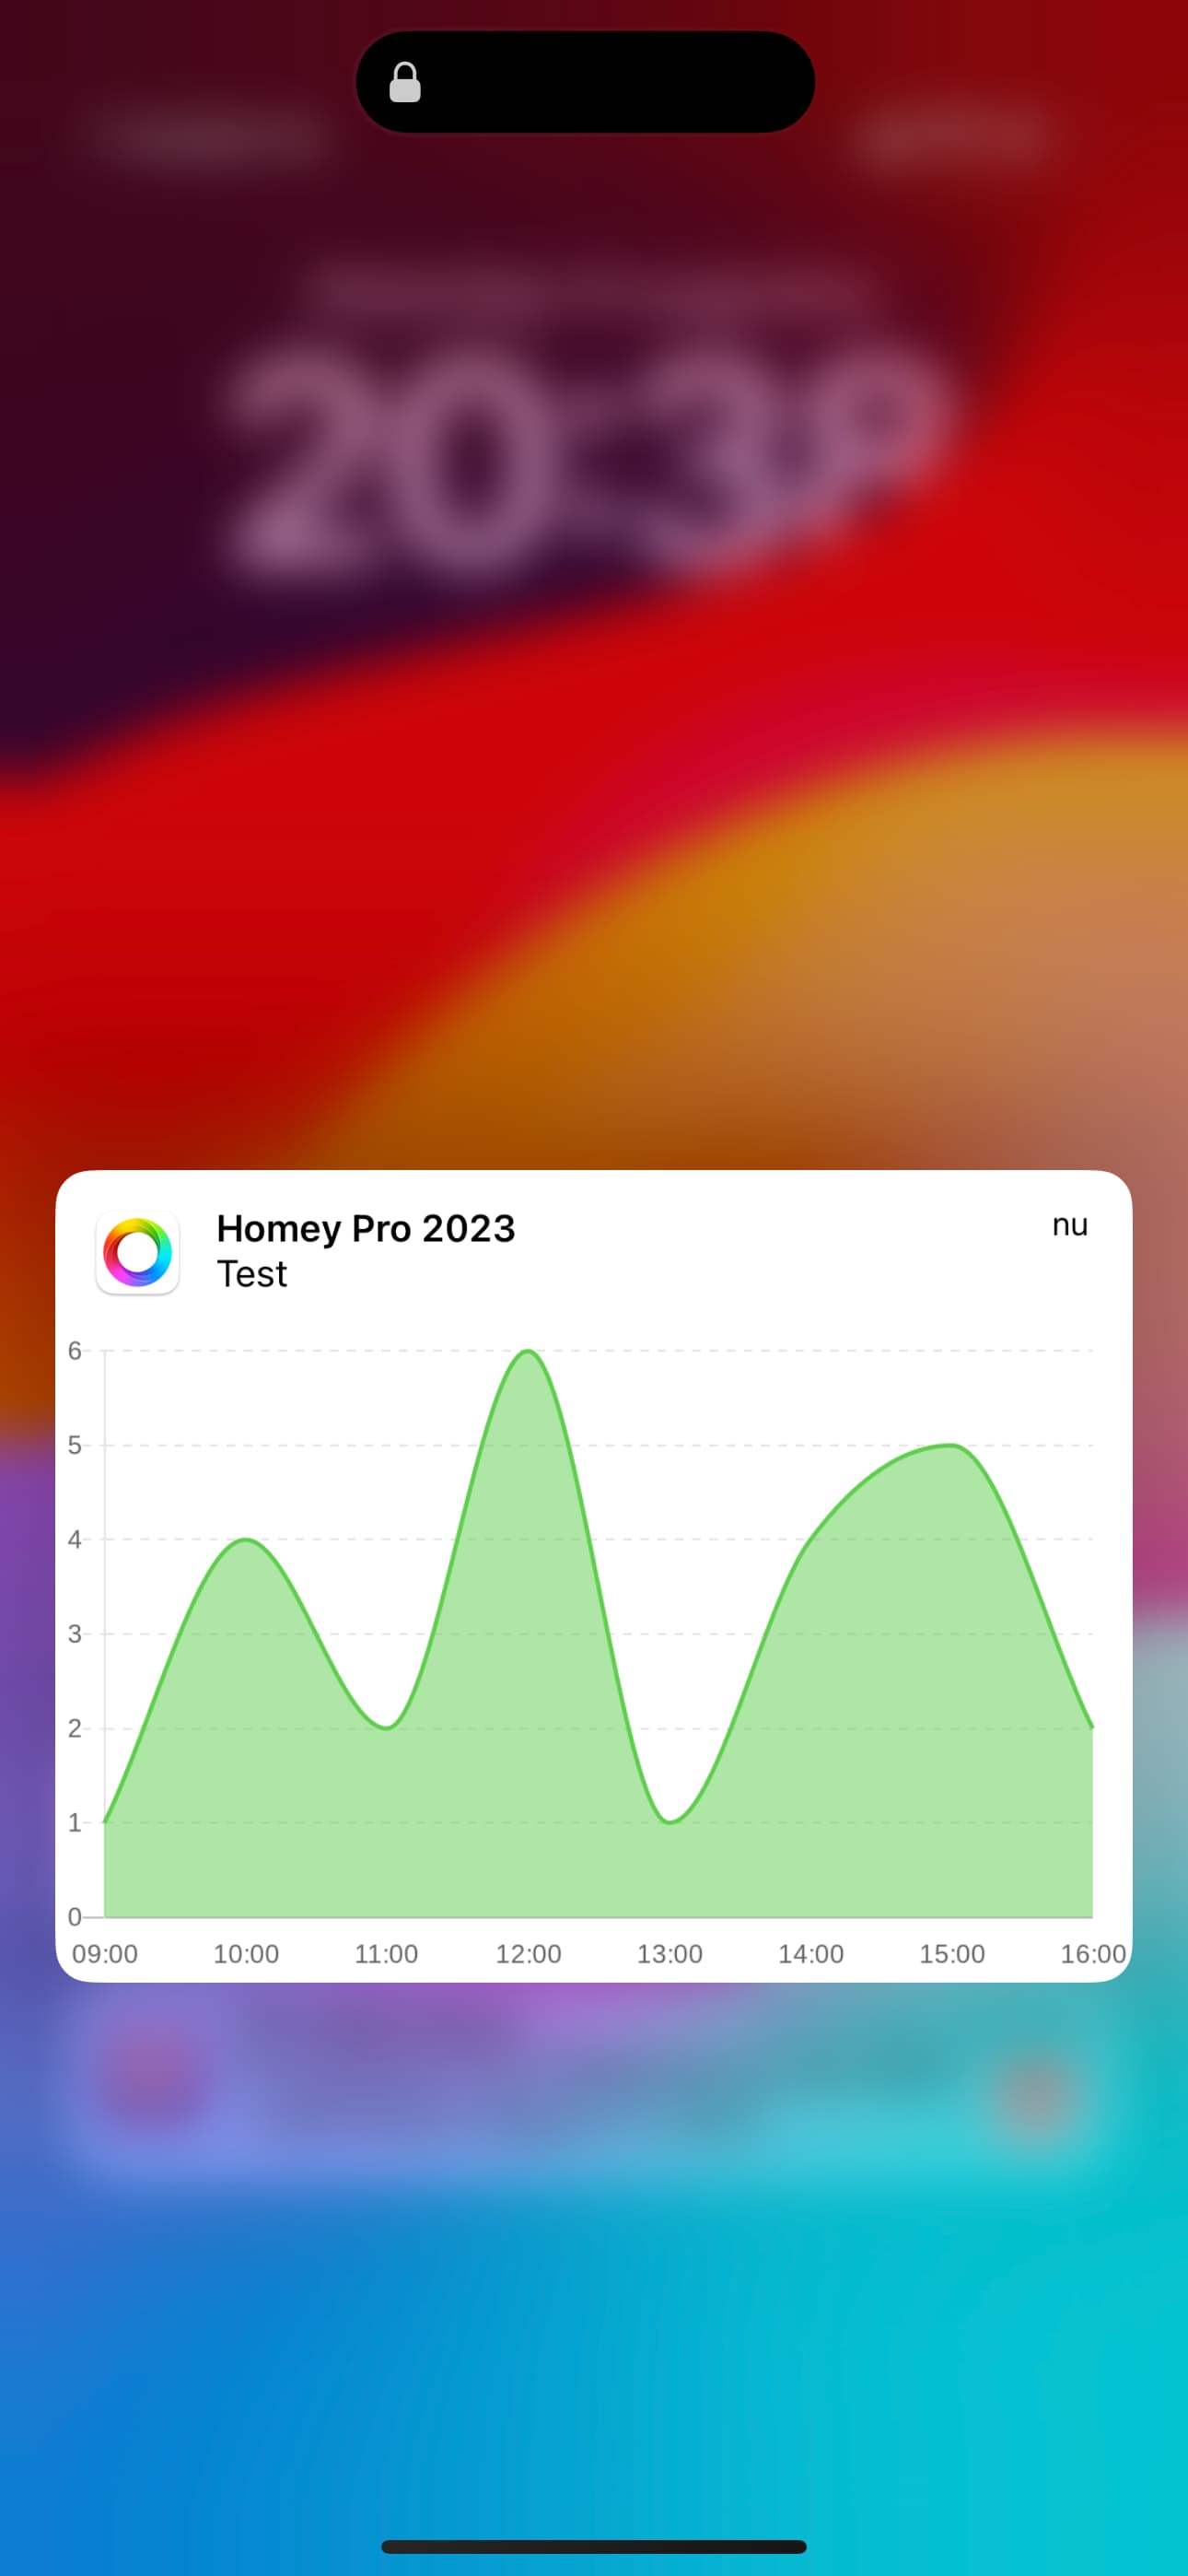
This app allows you to export any Homey Insights data into beautiful graphs.
Currently has support for:
Color picker for graphs in trigger card
Select a time window (day, week, month, etc…)
Graphs image tag
Light, dark or transparante for auto light/dark mode graphs
Graphs types: Line and bar
Exports can be easily scheduled by using a trigger card and Insights Graphs action card in a flow. You can schedule by day or week or with time window you need.
Cool app!
I just have a question: How did you handle the forced interpolation done by Homey?
The images you have posted shows temperature with 1 value pr hour. Homey is automatically interpolating values for every 5 minutes when selecting “24 hours”, even if my temperature sensor is only posting a value every 20 minute
Do you have the source code public somewhere I can have a look?
As Homey already screws the original data by interpolating to 1m/5m/1h/6h intervals, its interesting to see what you do on top of this to try to correct the data
Are you stripping all the similar values to remove the stair-case graph?
My day-job is timeseries data, that’s why this is interesting
I use a timestamp convert all Homeys data to that timestamp and make a new collection with the choosen timestamp. Them all data gets combined and I calculate the highest values. And return my own new smaller list.
Isn’t it more simple to just use all the available data points and let Chart.js do the “hard” work of converting them into a nice graph? Then you can leave out the step of creating your own smaller list. That way the chart should be a bit more accurate, right?
You can configure Chart.js to show you a max amount of ticks on the xAxes using maxTicksLimit .
I did the same for the charts in my own dashboard:
Thanks for the feedback bas I’ll take a look!
I decided for chartjs with a site to make the app more lightweight but I’ll run some tests. It would be better to run 100% locally.
I will also work in making a device for homey so you can see your graphs within the homey app.
I am plating around Sith the app but i zee you use aan app to send the image over Whatsapp, what app is that? I am using Callmebot but it doesn’t have the option to send aan image.
What exactly do you mean? You choose any trigger card. Then the insights graphs advanced action card. Then a message action card and choose the graphs tag as image there.

 Color picker for graphs in trigger card
 Select a time window (day, week, month, etc…)
 Graphs image tag
 Light, dark or transparante for auto light/dark mode graphs
 Graphs types: Line and bar
 English
 Dutch
Dutch