yes, please do send me a report.
Strange! Not able to send a report. Get an error "Rate limited! and no report send.
throttled by homey, maybe check or clean up your apps.
Don’t understand why, will try again later!
This won’t work without an installer account.
Scan the QR code on the inverter and then log in with the password from your installer.
But then it gets pretty crowded on the site.
Maybe remove a few from the only read?
Grid and AC
Managed to create this report when installing the app on my old Homey16
a8e5d639-9d0d-467e-99a2-b56e451eed72
Have you tested the connection via Windows?

But is it device/ModBus specific, or some problem in the app?
It seems you are using a different device (me: Huawei) - so that could indicate that it is not a device problem - just an idea.
it is a device issue, just passing on what I get from the inverter
We cleared that earlier, data comes from the device. Growatt’s shine data shows no peaks, edwin assumed earlier that they filter out these peaks somehow, the shinelink receives the same…
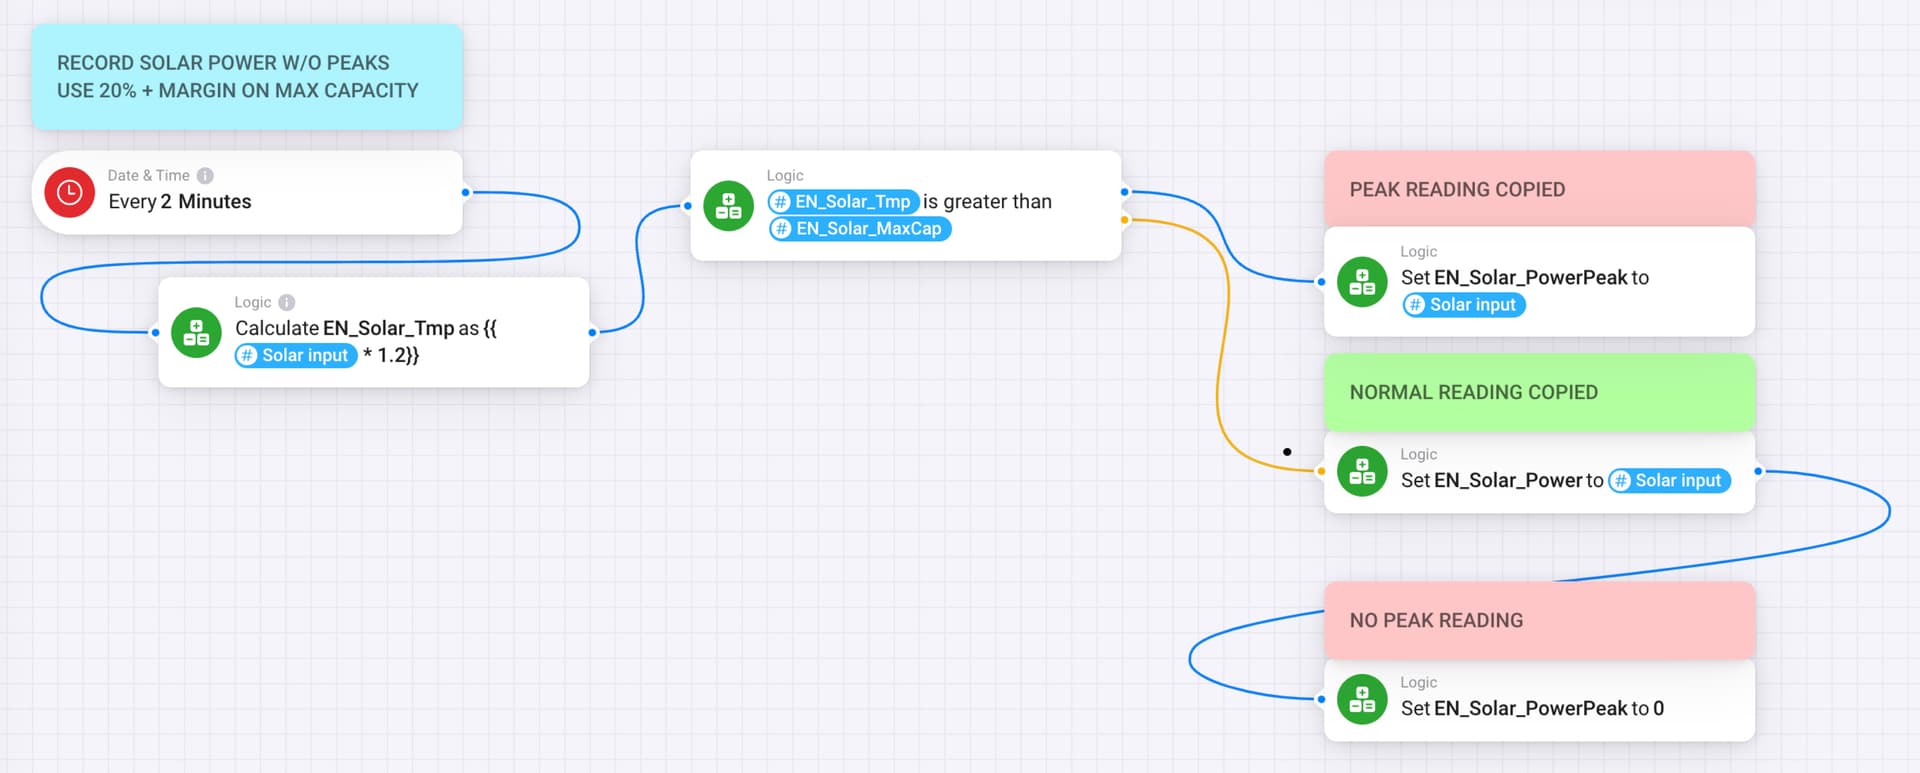
Some flows rely on this data so I decided to put the data in vars en use a raw filter to drop the peaks and record only true (normal) value.
~chears !
@Phil_Bro thanks!
my approach:

indeed a workaround, but seems I have to do it for all the other values as well …


You might need to be more precise. During winter, the max possible production will be less than during Summer, unless you over-dimensioning for periods other than summer and depending on the weather.
Peaks might occur on a rainy day, zero production but below the max value of 13.200W
Using the seasonals, you can do this easily by determine the max possible Capacity of the setup.
I Spain I added the weather conditions since they are default sunny so when NOT, I adjust the max. capacity with that.

Found another practical solution for charting in Dashboards App for Homey | Homey - as the “destroyed” charts were bugging me most.

By taking the minimum values of the past 15 minutes, peaks a simply ignored … perfect would be probably the median, but that is not supported.

Did you consider this app : Insight Trends Reloaded?
I will check the Dashboard App later this evening.
- Dashboard App → API → Homey Pro 2023.
I have 4 Homey Pros 2019. Close, but no Sigar.
Already use Insights Trend Reloaded (but for other purpose).
- use the slope of the living room temperature change to control some setting of the heat pump / heating
For my diagram now I filter out the spikes with the Min-value over 15 minutes … good enough to show me the daily PV production properly.
Hello!
I installed the app and set the parameters but I got no data from the huawei inverter.
This is the report: 84fa853a-6686-4317-918b-0f39db47e5ce
Coud someone tell me what is wrong?
Thank you !
