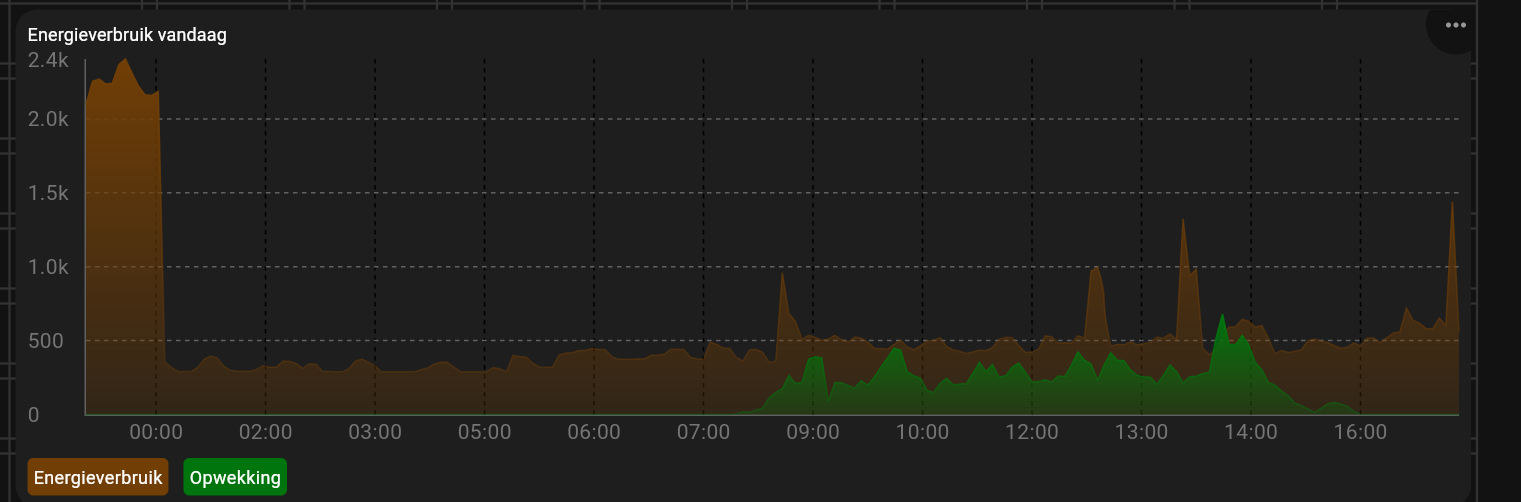
The problem starts with: these values are perfect for a graphic. Because these values changes a lot and the graphic makes this visible.
However, i want a card on my dashboard that calculates the amount of energy in kw that i delivered back to my energy company (so only the energy that’s to much for that day and what i can’t use).
I tried to make also a flow, but the valvues are’nt correct. Could someone help me what the problem is:
‘Vermogen’ (Power) is kW, your used, produced and delivered back is kWh, you need to measure Power used and Production over a period of time to convert it to kWh…
The time-factor is missing in your flow. If you are using 1000 watts during 1 hour your power consumption is 1 kWh. But the power is not constant. So you should check p.e. every 15 seconds what the power used is. Let’s say you are using 450 watts during these 15 seconds.
During this 15 seconds you are using 450 watts * (15 seconds/1hour) kWh.
Depending upon the app you are using for your solarpanels, there is a tag which has the number of kWh produced this day. Also you P1 meter has kWh meters, but then for the total amounts. Using Power by the hour, daily figures for imported and exported kWh are available.