Differentiate data from no data in Insights and ability to chose historical period

Hi!

Relatively new user here. I come from Telldus Live! to Homey and I wonder why I didn’t do the switch earlier!

I use historic graphs a lot and Telldus Live!'s excelled in that so Homey Insights was one of the strongest selling points for me when I was looking for a new system. However I have realized that Homey in not as strong in receiving data as the Tellstick especially over the 433 Mhz protocol.

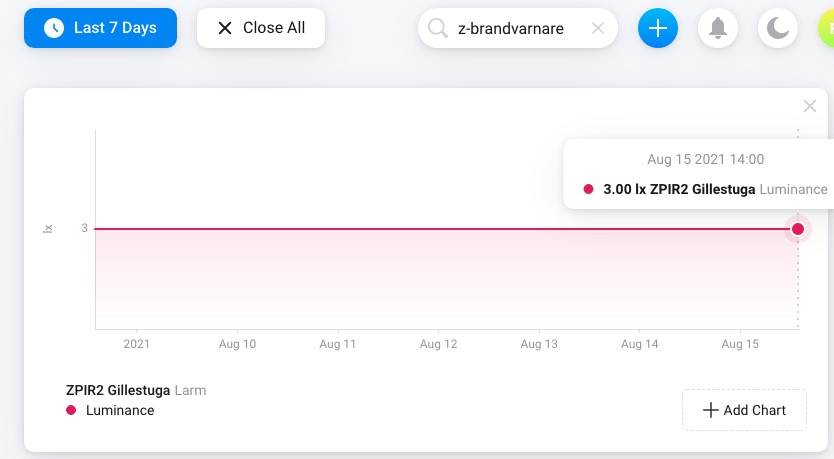
In Insights the graphs are showing the same value as the latest data it has received until it receives a new value. So if Homey register a thermometer at say 09:23 with the value 23° C and no value again until 12:05 the graph just shows a straight line. During this time the temperature could have changed several ° up or down with no way for the user to know. If there was a way to show registered data points and differentiate them between no data periods it would be easier for the user to relocate sensors and/or Homey to get the best communication.

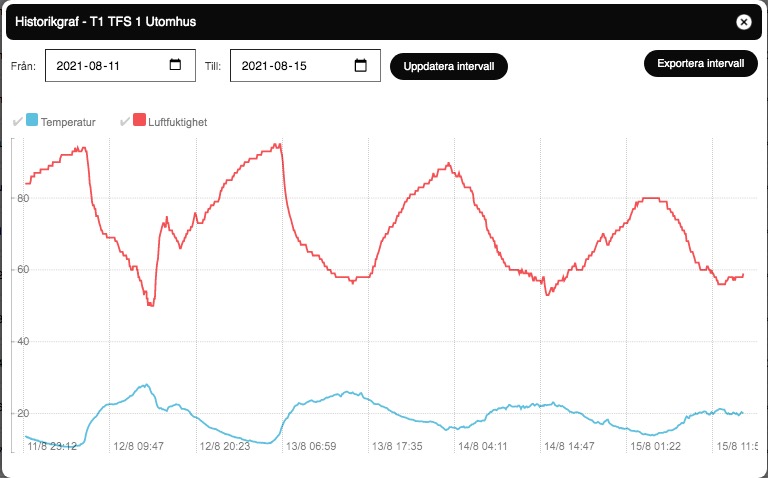
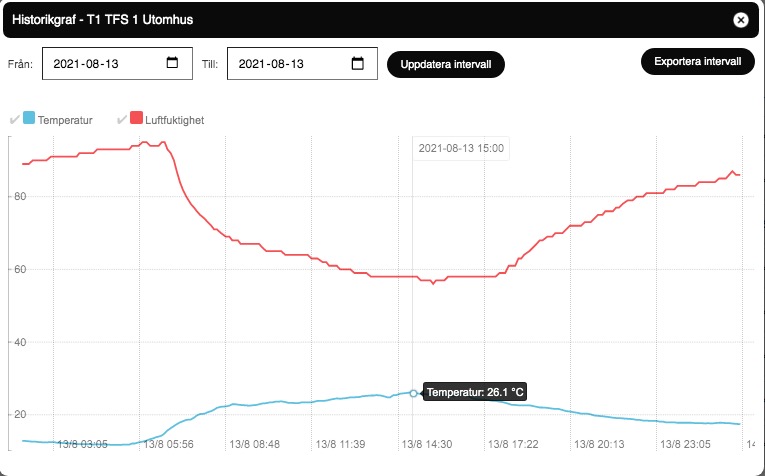
Also, in Telldus Live! it’s possible to choose to view historical data from dates. Lets say I’d like to see what the outdoors temperature was two days ago (Friday). In Insight I then have to choose “Last seven days” which gives a graph that is not very detailed. If I could choose the date (in this case 16:th) I would get a 24h graph over the temperature on Friday. The optimal function would be to also have time sliders, so I could choose a date and then slide to zoom in on a specific hour or even minute!

Well those are my first two suggestions. I hope they are not to wild and crazy! :blush:

Cheers from Sweden

Homey has no idea how often sensors update. For all it knows, your sensor only pushed two values, one at 09:23 and one at 12:05. The best it can do is interpolate between the two values (well, or just show each data point as a single point, but that would make the charts unreadable).

Homey aggregates data points. In other words, it doesn’t store single data points indefinitely, it averages them over time. The reason for this is that Homey has limited storage, and all data is stored locally.

I don’t know the exact aggregation window that Homey uses, but conceptually, I think it works something like this:

  • store each individual data point from the previous hour
  • store an average datapoint for each 15 minute period for the last 6 hours
  • store an average datapoint for each hour for the last 24 hours
  • store an average datapoint for each day

Insights is nice to get a quick overview, but if you really want to delve into your data, you should consider exporting the data to a proper time series database like Prometheus or InfluxDB (there are apps for both).

2 Likes

I don’t see the problem. Let me show how the Telldus Live! systems historical graphs looks (I have been waiting for Telldus support to do a restore of my system that have been locked for over a month. :face_with_raised_eyebrow:).

Here is the temperature graph of a Fibaro smoke sensor that doesn’t report that often:

As you can see there is a small ring on the graph showing the point that the data “21,4°” was registered. This ring is only displayed when the pointer is near the data point. If I drag the pointer to the right there will be nothing displayed until it gets near the next point which is 14/8 23:50. The cursor jumps between registered data points which makes it very easy to see if a sensor is active or if it’s not reporting/registrering in the controller.

To compare with how Homey Insight display data, this is a Fibaro motion sensor that the battery died a few weeks ago:

There is no way to know if the sensor is working or if the value is just the same since if you sweep with the pointer there is no graphic difference. Of course, if a lux value haven’t changed in a few weeks you might start to suspect that something is wrong…but I’m using these extreme examples to show what I feel is a potential improvement for Insight.

About a function to chose historical period I can’t believe that the amount of data would be a problem. I’m not talking about storing data for years and the ability to show every single data point from say May 10:th 2018.

Again from Telldus Live!. This time an outdoor temp/hygro sensor first showing the default display. Note the date span:

Lets say I’d like to check what the outdoor temperature was at 15:00 on the 13:th (two days ago). For this I change the dates to 2021-08-13 and 2021-08-13 making it show only that day:

This gives much higher graph resolution than the Homey choice of “Last seven days” that is the only option available if I want to check sensordata older than 24h.

I’m no programmer but I know that virtually nothing is impossible in the digital world. The only hurdles are money, time and will. If there is a will you only need time and money to get it done.

Maybe I’m alone in wanting this for Insight and then there will be no will from Athoms side to develop it. But if many users agree with me maybe they will take a look at it. That’s why I posted this under “Ideas & Suggestions”.

1 Like