I didn’t find any suspicious individual apps though. All have low single-digit cpu loads. And when I would sum them up it would still be a far reach from the peaks I’m seeing in my overall CPU load.
Is this normal behavior? If not, how can I figure out what is causing this load? Also the developer portal isn’t off much use. “App performance” shows flatline 0% all the time
I actually have zero direct zigbee devices connected to my HP23. Only via the Philips Hue hub.
Now on wifi, will try on ethernet one of the next days. Who knows maybe that’s causing the high load.
Hmmm, it’s just over 50% every now and then. Not an issue imho (correct me if I’m wrong here). But I can imagine one wants to know the cause.
These are my 10 year old NUC cpu’s 24/7
Not really clear on the screenshot, but the peaks go up into the high 70s.
I’m new to Homey and only have a small amount of apps, devices and flows setup. Planning to add a lot more, so for sure this can become a big problem. Also I would very much like to know where all the load is coming from.
I’m concerned personally about CPU peaks just because of the temperatures, as it’s connected… after all, those peaks shall not represent anything wrong but still - strange that nobody knows because then nobody might be seeing potential problem behind
Where exactly can you see this? I really have a lot of issues since a few weeks (mainly huge delays) and can’t find the issue, even got a loaner from Athom, but if I restore my backup on that the same thing happens but more frequently (say all the time) while with my own homey it happens a few times a day. I notice it immediately because all my Niko hardware starts blinking red, and well also the lights don’t go on anymore when I walk in a room.
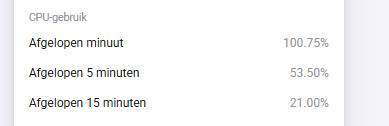
If I look on the homey webpage on that moment I have seen cpu average over the last 5 minutes going up to even 117% (don’t know how that is possible), but mainly around 80 to 90% while normally it is more around 20 to 30%.
Have already disabled various apps and flows, but issue seems to be just everything zigbee, thread and wifi works fine (govee for example)
When this means: all zigbee stuff slow things down, but Thread doesn’t:
This is because zigbee and Thread share the same chip, called MultiProtocol.
In general it’s not recommended to use both at the same time, only Athom thinks it’s no problem and doesn’t mention the restrictions.
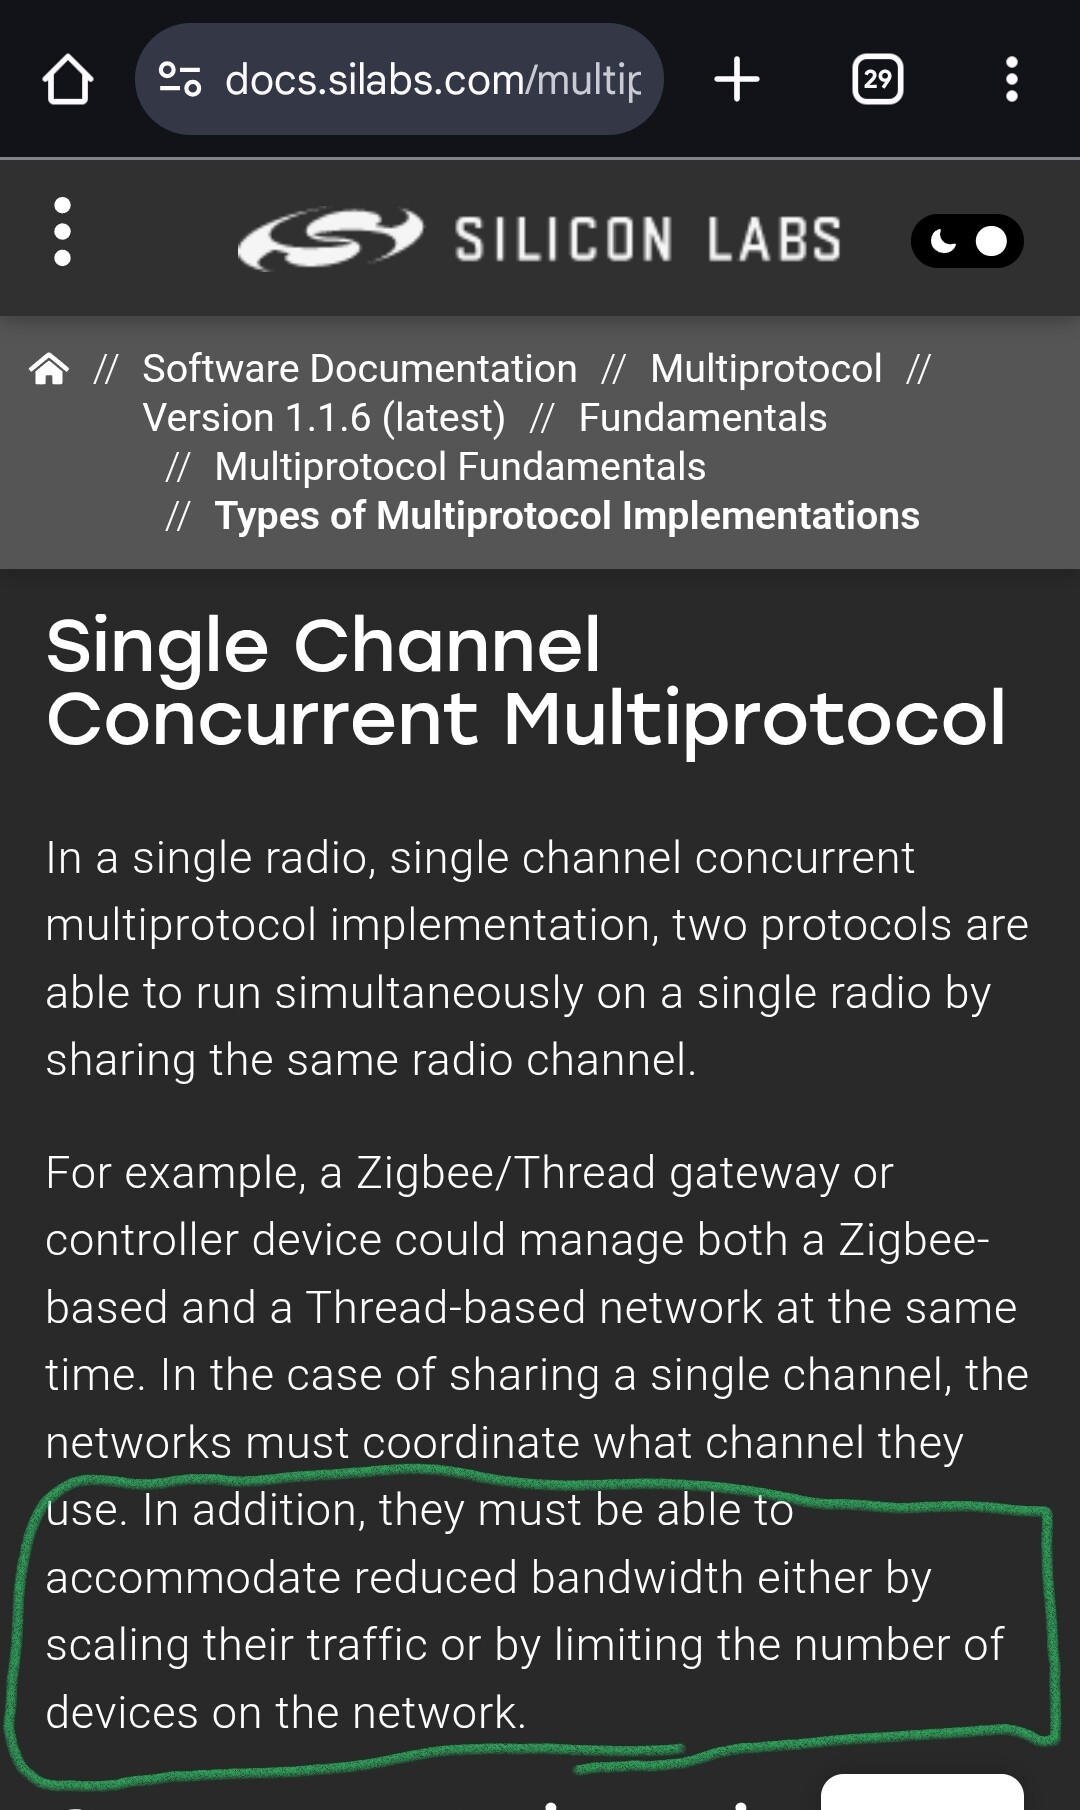
This is what the chip manufacturer shares about it:
Try to disable Thread, to see if zigbee starts behaving as should.
Starting from zero might be a plan as well;
To try to find the cause, you can start by disabling all apps, and then enable them one by one, with maybe 10 - 15 minutes in between, and check the system insights graph, or cpu
.
Other system “killers”
I found out, too many triggerd flows by “the Power changed” (this triggers every sec), caused the system load to rise. Reaching 300% was no problem (Pro 2019).
thanks, I never realized that I could also see system diagnostics in there, thought it was only for energy stuff etc
That said, if I look at the CPU usage for the past few days it says maximum 40%, so how would it then be possible that I see over 100% in the average values directly on the system settings??
I definitely do not have an every second trigger, most are just triggered by motion or by certain time.
I did disable ALL apps BUT niko and hue without a bridge, since those are actually (almost) the only zigbee devives that I use, the rest is mainly wifi stuff, but that didn’t help either.
At the moment since I saw so many problems with the niko stuff, I disabled the niko app and restarted homey, and so far I have not noticed anymore delay, of course it is only a short time, so it is early to say, but the last few days I had the issues like 10 to 15 times a day. If there are no more issues till tonight I will try to enable the Niko app again to see if the issues return again.
I was finally happy that the non working niko buttons issue was solved in V1.7.0, but apparently a new one appeared….see that it is now at v2.0.2
Regarding thread, I only have 2 zemismart roller shutter motors to open and close the blinds, but that works only half of the time since they disconnect all the time (and reconnect after a while too), Athom advised to check the settings of my border router, I thought homey is the border router? I’m not that familiar yet with thread/matter.
Anyway I disabled that flow already and just open them by remote now.
Athom mixes the descriptions “CPU usage” and “System load” or “Average load”
→ CPU usage indeed cannot exceed 100%
→ System load can reach 300% or more
There is also a handy monitor app available: SysInternals
.
A possible cause can be “chatty” devices, same as can occur with z-wave.
Certain Tuya devices are known to ruin / clutter the zigbee mesh by emitting way to much messages; probably certain Niko device types do this as well.
I’ve also read about a dimmer doing this.
Homey just tries to keep up, wich can cause these higher system loads.
BTW a CPU running at 100% is nothing weird, it only throttles down when there’s less to process, to save energy .
.
Depends on how you paired them.
But the description sounds as a range problem, the roller shutters seem to be on the edge of the range. And the range can always vary a bit, due to interference.
The only tuya devices I have at the moment are 2 contact switches and 2 buttons, but the issue I had was also when the tuya app was disabled. Still till now I have had no issues so far just by disabling the Niko app…