I don’t think I used the null values feature on the old app (if that was there? Wasn’t familiair with it), but when I switch it on this happened
First the value went to -0.1, then I switched it off and on again and now the value is 0, to that seems to fix something. I’ll see what it does now
I’m getting much better values now, tnx, I’ll see what this does
@spkesDE the reading are better, but the flow that needs to act on the trend value does not;
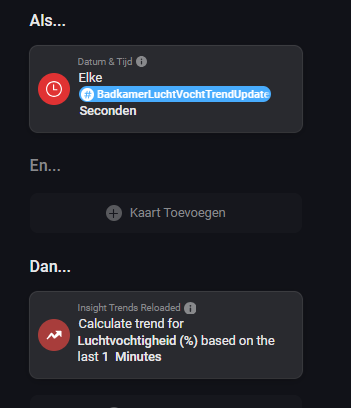
I have a flow that calculates the trend for humidity
I report the value (using another flow) to a variable (to see in insights what it does); the value goes from +0.5 to -0.5
but it doens’t respond to any value, except “equal to 0”, when clearly the trend goes above the 0.06 value I set in the flow
Any idea what I’m doing wrong? This worked with the old app (the lights in the shower turned on and off in respond to a humidity-spike)
btw I checked all flows to have the proper device/capability (*). Perhaps I need to change the “1 minutes” to a longer period? I’m not sure what it does, but I want the lights to turn on as quickly as possibly in respons to humidity
(*) one of the most annoying things about Homey; I cannot see what device is selected in a flowcard. Is there any way to do this? Can’t believe this is still an issue…
It seems that the above flow cards are not available anymore. I was pleased they were added. The winter season is starting now. I want to update my flows based on this new feature. But I see now they are gone. I hope you can re-add them, they worked very well.
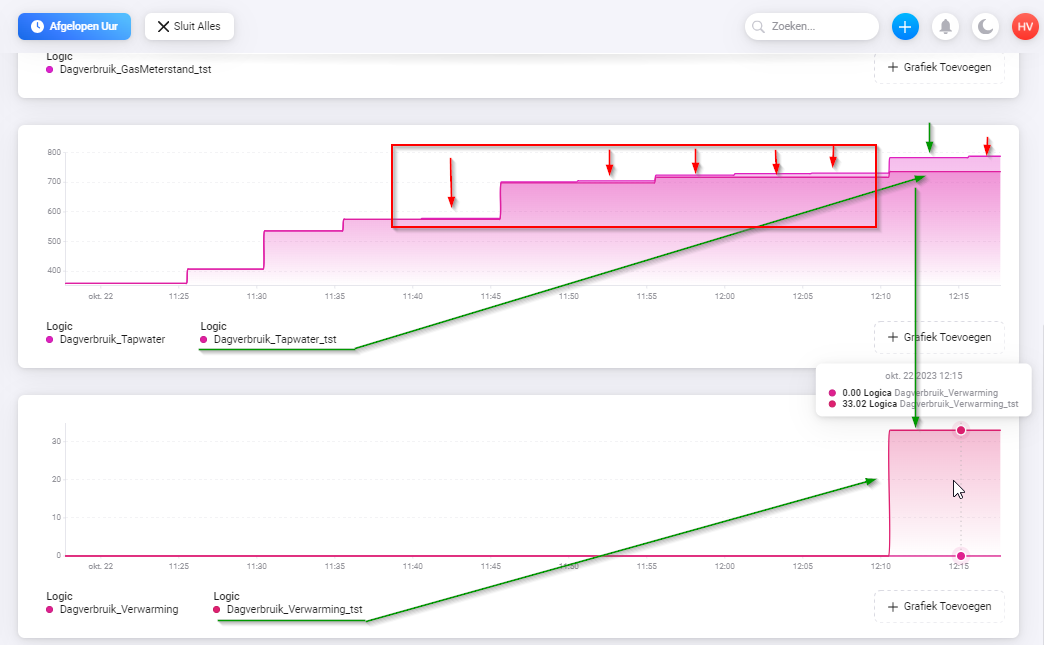
The new feature/method to split my gas usage into tap water (hot water) usage and central heating system by percentage works great. It is far more accurate now.
As you can see in the image. Usage below the green arrow is now seen as gas usage by my heating system instead of hot water usages. This is good!
Only the values below the red arrows are missing now. This is because the percentage are rounded at whole numbers. Is it possible to update the app so it can work with smaller units for example 2 or 3 decimal?
Many thanks @spkesDE for the quick app update. I have performed some tests this evening and it worked very well. The smallest amounts of gas usage changes are now calculated correctly too. I’m very happy. You delivered a great job!
Here is a flow in which the current consumption of today, yesterday, the day before yesterday and the past 7 days is calculated. Works like a charm! Thanks for this fantastic app, but this should actually be included in homey by default!
Hello!
Want to check the tempertaur during the last 24 h. to compare with the watt for my heating.
So i made do get a average value during the day and also check the max and min temp.
But i got Max=0 and that can´t be correct. Have i wrong variable/tag? But i cant find any other that feels right.
The value i got:
Average= -16,04 C
Max=0
Min= -21,1
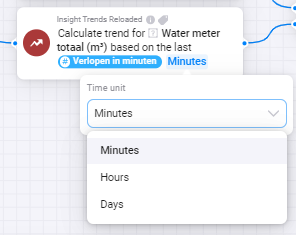
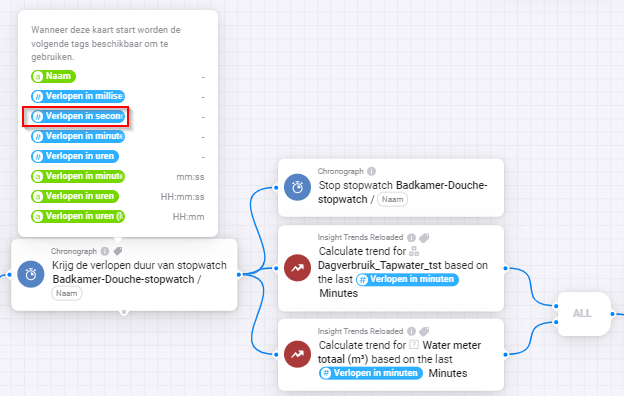
I will explain why it would be very useful if a “seconds” unit is added to the above flow card.
I want to calculate our shower and bath times, but mostly this is not rounded at whole minutes.
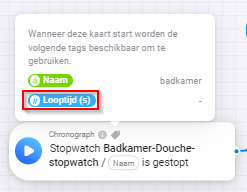
For measurement of the duration, I use the Chronograph app with a stopwatch. This is the input for the “Insight Trends Reloaded” app. Some of the Chronograph app even haven’t a minute unit. I hope this will clarify the reason for my question about adding a “seconds” unit. I don’t want to end up in more complex calculations to change seconds to minutes. It is not an easy divide by (/60) and rounding.
Thanks for checking anyway, I understand that a complete code redesign would be way too much work.
I’ll try to work around it. It seems possible to use a smaller input. (result of some tests: 1 min = 11 data points, 0.5 min = 5 data points, 0.25 min = 2 data points). The number of data points is already so small that it may not yield much extra in seconds.
I am trying to observe a trend change in temperature, but that is not very successful yet.