Oh sorry.
I used an old token - stupid me ![]()


Hi!
Using this app for a long time now, over 2 years? And works great, never gives an issue.
I use Grafana to create some Dashboards.
There is one thing which I just cannot find a work around for; Grafana and/or InfluxDB don’t allow to show a value if the last data point in the database is outside the Grafana timerange (so outside the Query timerange). This is no issue for frequent changing values, but might be an issue for values changing just a few times per month (or even year). This is not related to the Homey InfluxDb app, but a result from how Grafana and/or InfluxDB handle the queries.
The Homey InfluxDb app writes only changed variables/values (which is a smart thing to do) and I just noticed a flowcard “Write measurement … as number…”.
So I thought: let’s try to trigger sending a new value to InfluxDB even without an actual change in it by writing the current value as new value. But I either don’t understand how the flowcard “Write measurement … as number…” works, or there is something wrong. It does not change the value in InfluxDB which a varify by looking at the last value if it in Grafana.
Any idea’s which can help me further?
I noticed the same problem you have to force a value change by adding a inkremental small value to the original value. So the value will not change much but a little bit. This triggert the data transfer again.
In the following example you can see the workaround in action. My power measure device sends the same result as the day before. The problem would be that the the app would not transfer the value to influxdb. I add 0.01 kWh and the app will recognise the change of the value and transfer it to influxdb.

Thnx for the quick reaction. That will indeed work as well, but I’d prefer not to need to change the data (even if its just a small bit). I’ll first wait and see if anyone has an idee to get the flowcard from the Homey InfluxDb work for me ![]()
in grafana, change in de graph created the start date/time into -10d, for instance
Thanks for your response. I don’t understand yet what you mean; do you mean the time interval of the graph? Or is there another place where I should be able to fill in for example -10d (of a month or so)?

so it would like this
from(bucket: “homey”)
|> range(start: -3d, stop: v.timeRangeStop)
|> filter(fn: (r) => r[“_measurement”] == “homey_CO_Sensor”)
|> filter(fn: (r) => r[“_field”] == “measure_temperature”)
|> aggregateWindow(every: v.windowPeriod, fn: last, createEmpty: true)
|> fill(usePrevious: true)
|> yield(name: “last”)
Thanks for the additional explanation!
Will try it and share my results. No time for that this weekend, so will be next week.

I got it working in Grafana by increasing the relative time in the query options. Works for those graphs where the last value is used.
I assume it will not work for graphs where the average of for example the last day is shown and value did not change in that last day.
So I would still be interested in ideas on how to get that flowcard “Write measurement … as number…” to work ![]()
My expected behaviour of that flowcard is that any value will be written to the InfluxDB itself, also if the value is the same as the last written value.
Thanks, brought me to increasing the relative time of a specific graph/query. Works in my case.
I have exactly the same. It shows connected, but not getting any data in the bucket.
Dit you already figured how to solve this?
I tried adding a flow I have seen somewhere in this topic. But that doesn’t do much either.
Hello, would it be possible to expose the cache duration in settings? I would like to be able to set it as I might want to migrate influxdb to another machine without losing data, and having a longer cache duration would be very helpful with this.
Thanks
I’m logging all my data already for some time to influxdb and visualize it via grafana. However I renamed a device in homey which also means the historical data is now missing in grafana. Can I and how to rename the old labels in InfluxDB similar to the new ones? Merge them into 1 entity under the name name?
A couple of weeks ago I installed this app, and some days later the latest test version v1.2.2.
My problem is that I don’t get any data reported for any Aqara sensors. The sensors appear in the influx database, but no data is being stored for any capability on them. (insight data is OK)
I see some people in this Thread has had that problem as well, did you get it fixed somehow?
I am trying to find out out if I can increase the amount of data points stored in the Influx database by InfluxDB for a specific device.
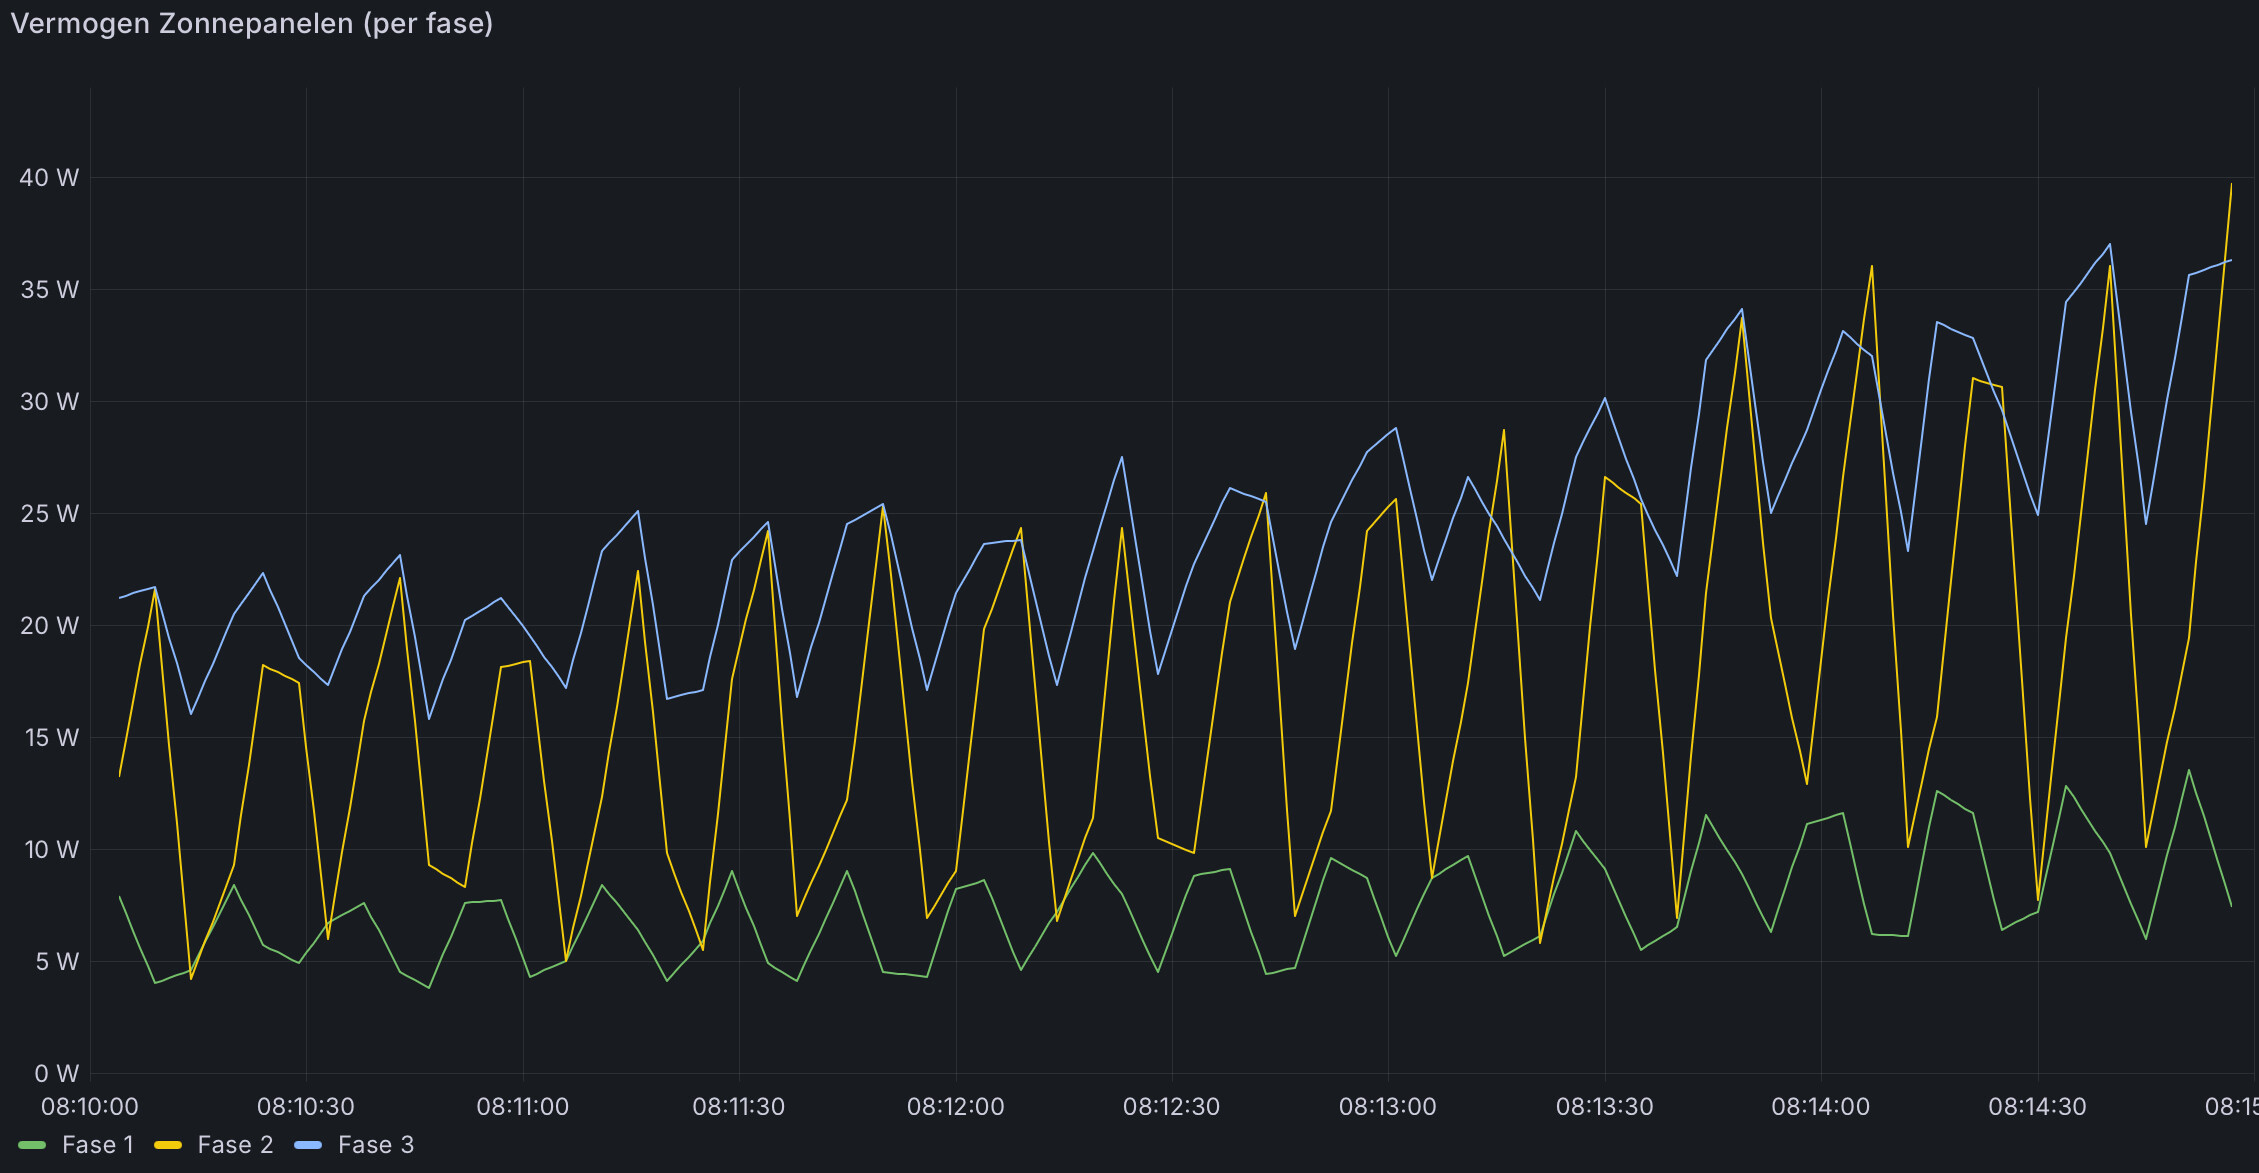
I have a Shelly Pro 3EM, which measures solar production. See below for a graph from Grafana for a time period of 5 minutes. It shows that there is new data every ± 10s but I would like to have more data in between.
If I look in the webinterface of the Shelly 3EM I see frequent changes in the measured values. Data can change roughly each second, so real time.
If I look at the same Shelly Pro 3EM device in Homey, I see the same. So very frequent changes in values.
I use Grafana to visualise InfluxDB data and it can also show the source in table format. There I see something different. Roughly each 10 second there is an update of the measurements.
Looking around in settings of Shelly3EM of InfluxDB app I cannot find any thresholds which for example only update a measurement with a certain change value. So I don’t know if and how I can make sure each change in measurement is stored in the database.
Any suggestions how I can find out if this is caused by Homey of InfluxDB or Grafana?
Or even better: any suggestions to fix this?
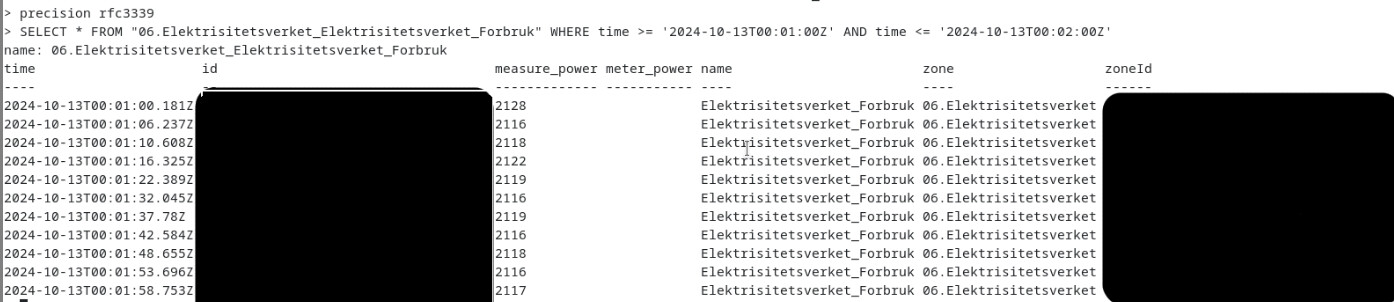
Firs of all, check what you have in your database for the measurement. If you got V1.x, you can do something like this in shell:
In general for Grafana: Querie Time “$_Interval”, will give you all the measurement points of that measurement.
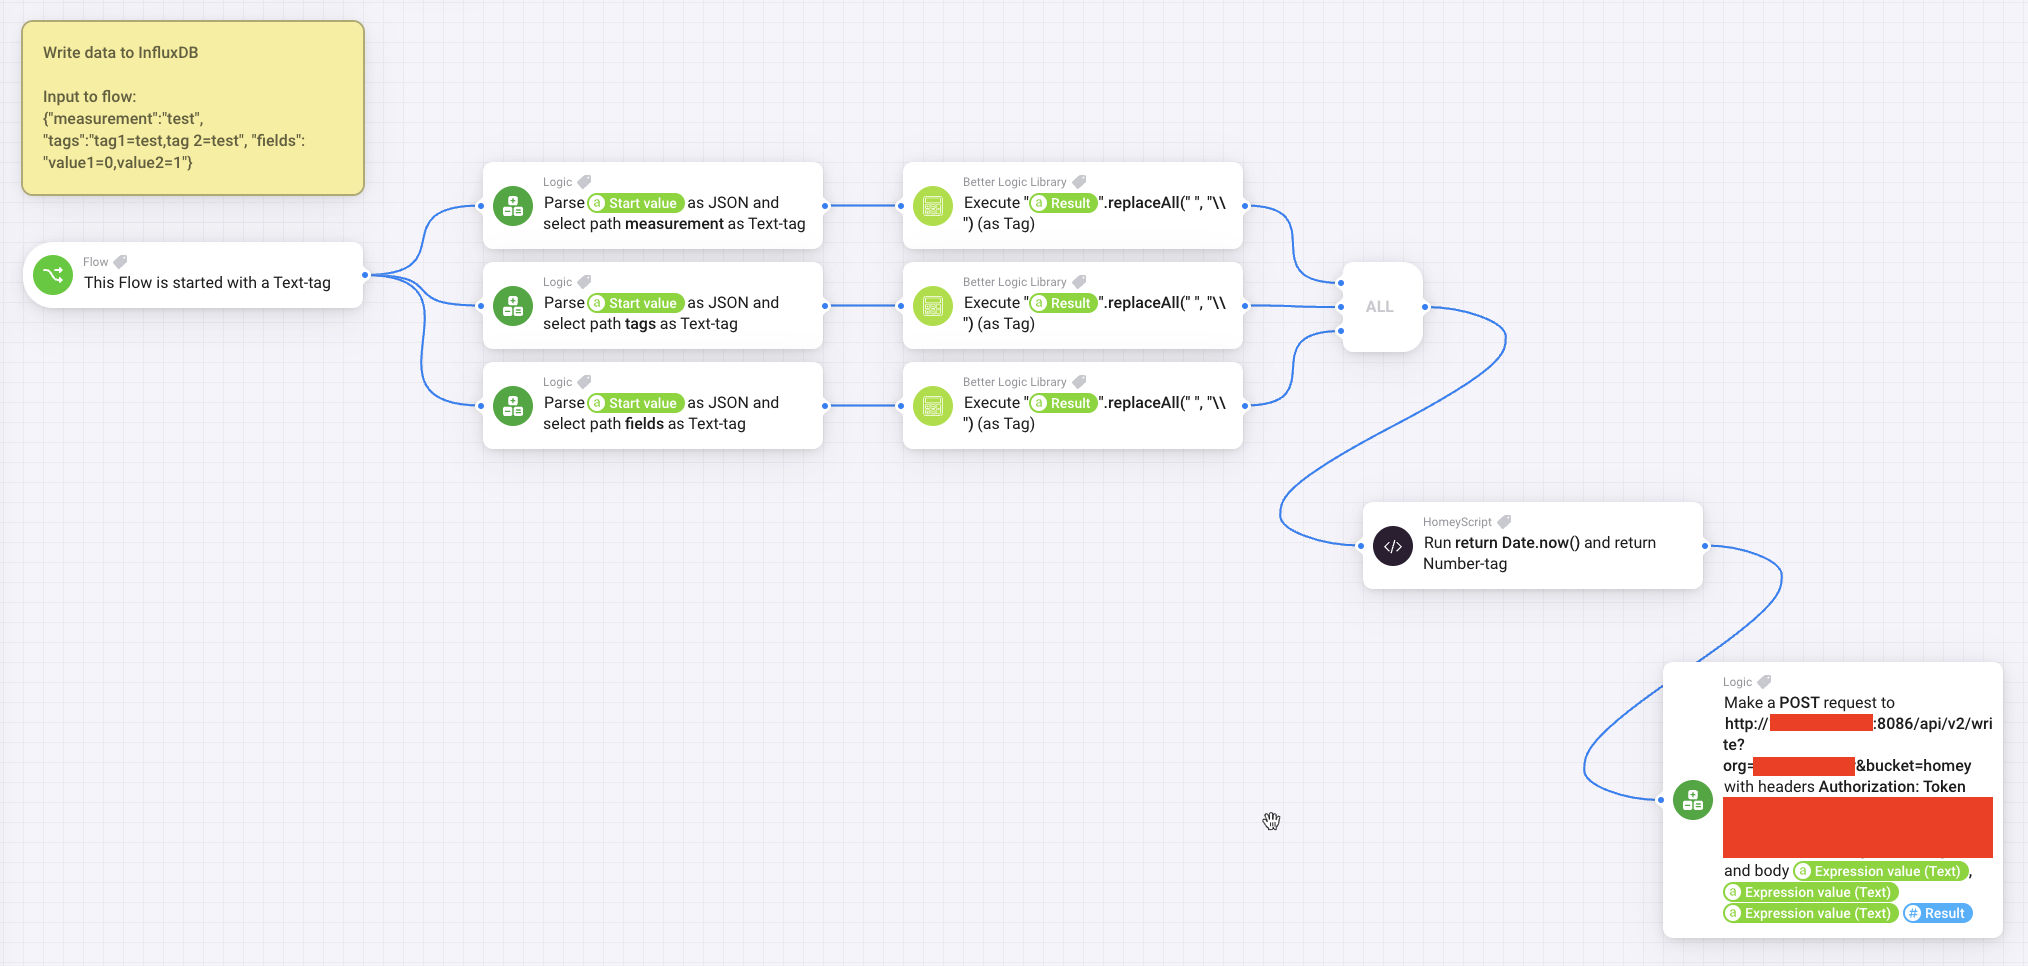
If you want more measure points then you have in your Influx database, you have to make more measuring points with parameteres of shelly (if possible) or append a new measuring with flow like this:

(Every 10 seconds - inluxdb online - write measurement card)
