I installed new version and have been playing around with the new stuff. Ok some issues im afraid. But first great work Marcus
If i have 0 value on a insight. And the threshold setting to 1 shouldnt the flat line have only the base color? It seam that i have to set it to 3-5 to get only the base color with that senario.
If i remove a object in the card or view if i had the settings visable for ex a capability it remain visable and doesnt get cleared even if i add a new entry. Have to cancel and then redo the removal without loading the setting.
Last but not least just a question. Does the boolean detection consider null to be false? Because i noticed i had a boolean variable that contained null as value and it didnt react very well. Fixed the variable to false after to solv it but wanted to ask regardless incase it should detect null as false sins it is apparently possible to get a null value in there.
When I try to access my dashboard, maybe 60% of the times, it’s actually loaded. The other 40% consists of a grey/white screen - nothing is loaded, no error messages in the web console. Trying a couple of more times, it’s usually loaded eventually.
I want to do some major changes, but it might result in it being challenging to edit dashbords on smaller and/or touch screens. This means that the best way to edit dashboards would be on a computer. Would this be a major challenge for you, or would it be okay in order to get more customizations?
As I don’t know of any better ways of conducting a poll here on the forum, just click one of the two links below based on your response. Both links point to this post, I just get a click counter for each of them
Thx for this new release with new features. When time is passing by and you’re quiet on this topic, we know a new release is coming… with surprises for us to unveil
I observed the icons are gone for logic variables, I guess as a result of this change? is this work to be done? Or on purpose? It gives a bit of inconsistency on dashboard with icons before capabilities…
A little bit of both?
Most laziness I guess. It’s been moved to the control, but yes, I agree, it looks out of place when it’s removed from the left side. I’ll get it back again
Great work as always … here my first notes (partly related to latest release, partly not):
color picker should maybe still show the hexcode if possible … this makes copying colors from one insight to another easier (if you want to ensure consistent coloring of e.g. all temperatures) - or at least it shall show which color currently is selected (if the component supports this)
option to disable the “view” part of the card … for a dashboard I do not always want the card to be clickable/openable - mosty I see exactly the same as before (and - at least me - I do not want to change any values here)
the more I dive into it with my dashboard getting more and more complex, I really wish to be able to change the order of insights within a diagram
So much looking forward already to be able to hide/color/style capabilities based on values (entire line or value only)
Fine to use on the PC, I just use it on my phone to check some parameters occasionally; most of my dashboard is not viewable if I don’t first press the card to see the “large version”
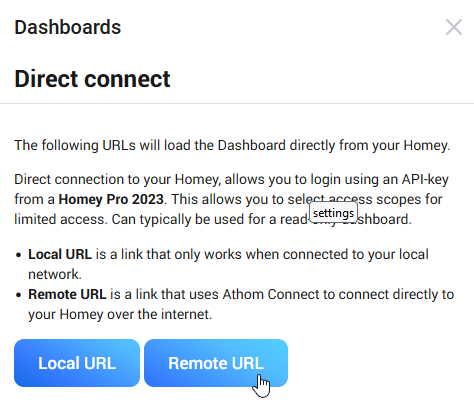
Would it be possible to further describe the difference between these two buttons? I really don’t get it. I have created three Dashboard devices in the Homey app. Then I have created the actual dashboards using the “Remote URL” button. All good.
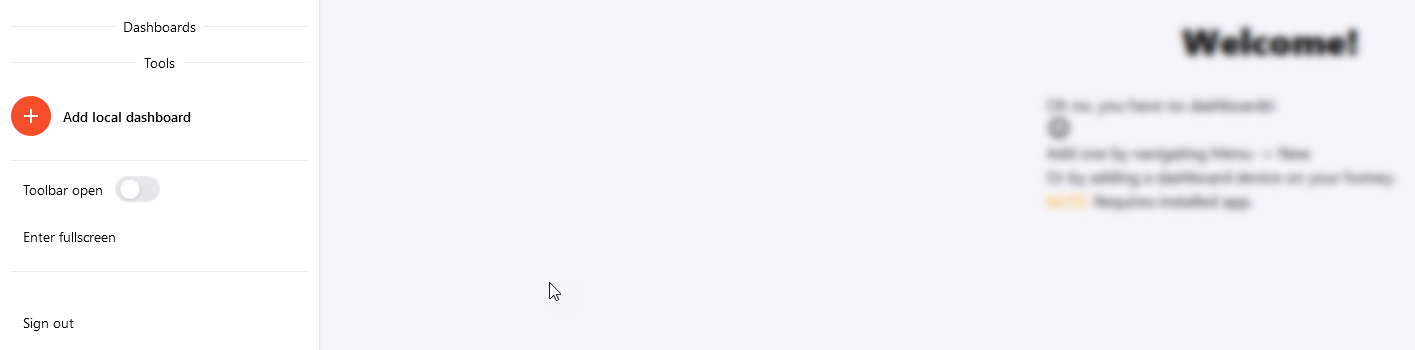
But what about the “Local URL” button then? Looking at the description, I would imagine to find my three already created dashboards there as well (when I am on the same network as the Homey), but it’s totally empty. I mean, the tablet on the wall could benefit from using the local URL, I think, but as I said, totally empty (“Oh no, you have no dashboards!..”).
Everything I can do using the local URL is to add a local dashboard.
I’m having the issue that after clicking once on my dashboard it stops responding. Doesn’t matter what: I can click on a dashboarditem, on the menu, or whatever. After the first click the page does not respond to other clicks
What can this be?
I should mention that I had to re-add a device that was not working properly and this was used in my dashboard. So now I have a device in my dashboard that’s not available (temperature sensor). Maybe this is a problem?
I think the problem here is the way linear gradients work according to the web-standards. The gradient works based on a numeric factor where all thresholds are translated into a number between [0, 1]. This basically means that with the axis range you have in your graph [0, 8000], the value 1 is translated to 0,000125. I’m guessing the graph is about half your screen width. If this had been an iPhone 12, which has 1170 pixels, this results in 1170px / 2 / 8000 = ~0.3. This means that pixel number 2 is at around threshold value 4.
A bit advanced, but what I’m basically saying is that your axis is too high to get the precision you’re looking for
I can explain all the technical differences and how it works, but any non-technical person won’t get it anyway. The main difference is that Local URL is only accessible when you’re home, and Remote URL require internet to work even at home, and works outside your home.
I do know that there’s a bug that force you to refresh the page in order to actually load the list of dashboards. Other than that, you must either select homey as API-key scope, or at least homey.devices.readonly in order to list dashboard devices.
This is a very plausible cause! I’ll try to add some tests and see if I can mitigate this issue.
Since version 0.15.2 the card and view “views” are the same. Deleting something in one view is also changing it in the other view. It is not possible anymore to show different values or insights in both views.