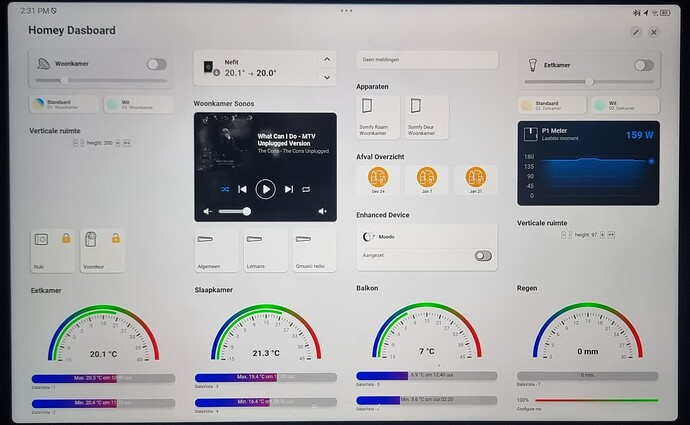
Please do write in english for all people to be able to contribute.
You are absolutely right.
If a person start asking questions in my native language in an english tread I just start typing out of enthusiasm in dutch.
Will never, ever happen again ![]()
How did you get 4 columns on your A9+?
What settings did you adjust to what value?
Go to Settings > Display & Brightness, then select the smallest text size, and Zoom in on screen to smal.
I really hope so ![]()
Do you use the “Fully Kiosk Browser” app?
He will need to use the “Fully single app Kiosk” app for that ![]()
correct, “Fully single app Kiosk”
Is your buienradar refreshing @Peter_Kawa mine stays on the same time
Refresh the page every 60sex
When closing the honey app it’s working
It’s a bit fuzzy with iframes / web widgets.
I also read lots of other things don’t auto update.
But your buienradar is refreshing ?
Hi @Mark1541
I reported this some time ago at support. It is refreshing every minute. So do not blink your eyes. Otherwise you do not see which direction the clouds are going.
And I (and assume many outhers) want to see a 3 hour forecast.
This is the Athom buienradar widget. Not the iframe widget.
@Doekse
I send support an email about this but never received an answer.
Rogier
How do you make de gauges in Homey? I can’t find it.
DataVista widget, Ria
Here’s my concept dashboard since I discovered that I can use HTML code in the Status Display of Enhanced Device Widget.
So basically what you see is simply text, in html format, with links to logic variables.
Those variables I set up before to create my own energy oversight, so I only had to put them in a dashboard to create this.
This is just early stage… one evening of work. But I really like the fact that even html table coding works. So I got this right now.
And when active it changes to
(Don’t pay attention to the numbres, as they are currently incorrect due to calculation changes)
For convenience I coded the HTML in an external program, en copied it in an advanced flow.
The logo’s change based on a simple boolean value from logic variables.
I saved some space in the header where I will add the current power consumption.
And these logo’s where quickly found on the web, but I will make better ones for my own in photoshop when I have some spare time.
Really happy with this result so far.
Nice to see you dived into the Enhanced Device Widget’s possibilities!
@Adrian_Rockall check that dash ![]()
![]()
![]()


