Motion Alarm History / Insights

In the Official Doc’s App Reference (link) it says that the alarm_motion capability both “supports” insights and is gettable.

Meanwhile, there is no “motion alarm” option available in the Insights UI. Looking into fetching them somehow through the API returns only the most recent 50 “events” for a device’s capability. While trying to work around this using the other available “resolutions”/time period selections return a 500 response stating that boolean_with_resolution_not_allowed.

Is there indeed a limit of how far back motion alarms are stored (if so, is there are reason for it?), or can it be fetched by other means?

Based on this post in the old forums (link), it might seem that at least downloading longer periods of motion alarms was possible back in 2018?

I see that there was a request for the same in 2019 (link removed due to limitation in the forums…) perhaps, with some proposed workarounds - but wouldn’t it be best if it indeed was made available through the insights?

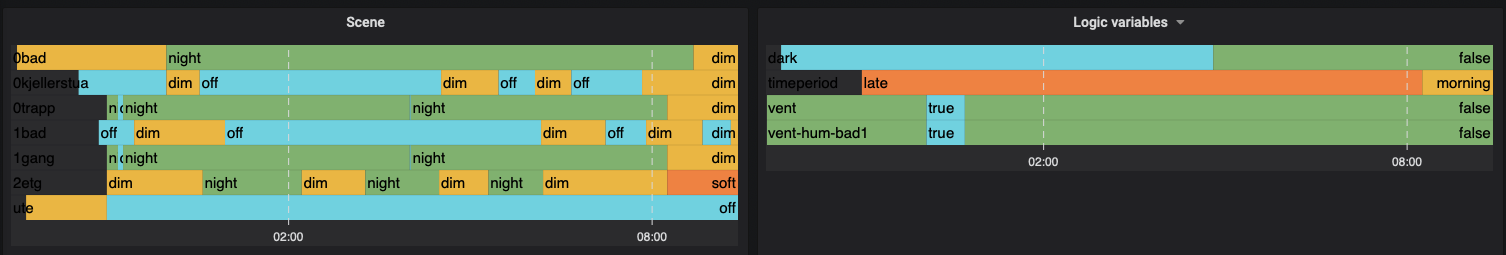
This chart below is not that interesting as it only has the latest 50 “state changes” but could be across longer periods of time.

It sounds like 50 events is some sort of arbitrary limit that Athom imposes on storing boolean data. I believe that boolean data previously wasn’t stored in Insights at all due to the fact that it cannot be averaged, which is how the Insights database works for numerical data: the older the data, the more condensed it gets by storing averages instead of actual values. So now apparently booleans are stored, but only the last 50 of them.

How I read the old post is that the creator of the heatmap was using an external database to store values, and use that database as source for the heatmap. Insights is nice for Joe Sixpack, but if you want to do proper data analysis you should consider exporting to InfluxDB or Prometheus (a Homey app exists for both).

Completely unrelated: an API returning 500 when the query isn’t valid? Who thinks of these things…

1 Like

:joy: :rofl:

Just found a even better example/visualization, by someone called Solweb, illustrating it in Grafana with influxdb.

However, I’m still dumbfounded why this should not be possible in Homey natively…

Image credit to Influxdb and Grafana - Homey