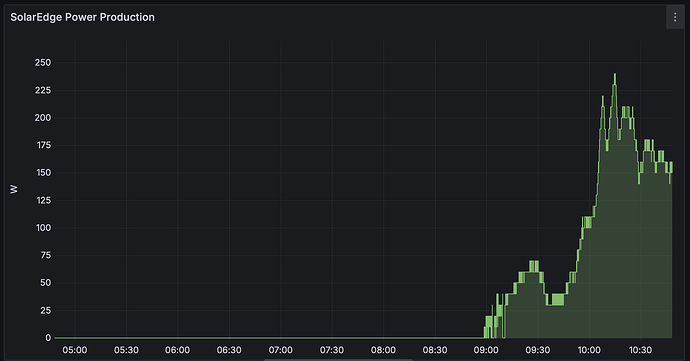
This is a guide for those who like to use Grafana to visualize their data.
Requirements
- Homey Pro or Homey Pro mini
- A Linux server, such as a Raspberry Pi
1. Install Docker
Sign in to your Linux server and open a terminal.
If you haven’t installed Docker yet, do so by executing:
$ curl -sSL https://get.docker.com | sh
$ sudo usermod -aG docker $(whoami)
$ exit
2. Install TimescaleDB & Grafana
Sign in to your Linux server and open a terminal.
Create a directory in your home folder:
mkdir homey-grafana
In this folder, create a file named docker-compose.yml:
services:

  timescaledb:
    image: timescale/timescaledb:latest-pg17
    hostname: timescaledb
    container_name: timescaledb
    restart: unless-stopped
    environment:
      - POSTGRES_USER=root
      - POSTGRES_PASSWORD=toor
      - POSTGRES_DB=homey
    ports:
      - "5432:5432"
    volumes:
      - ./TimescaleDB/:/var/lib/postgresql/data

  grafana:
    image: grafana/grafana:latest
    hostname: grafana
    container_name: grafana
    restart: unless-stopped
    user: "$UID:$GID"
    environment:
      - GF_USERS_ALLOW_SIGN_UP=false
    ports:
      - "3000:3000"
    volumes:
      - ./Grafana/:/var/lib/grafana
Save the file, and execute:
docker compose up --detach
Your server will now run Grafana on http://<ip-of-your-server>:3000.
3. Install the TimescaleDB app on Homey
Visit http://homey.app/a/net.weejewel.timescaledb and install this app on your Homey.
Once it’s installed, in the Homey mobile or web app, navigate to the app’s settings, and configure your TimescaleDB URL.
This will be in the format like:
postgres://root:toor@192.168.1.3:5432/homey
Replace 192.168.1.3 with your server’s hostname or IP address.
Once you’ve clicked Save & Connect, the app will let you know if it’s connected to TimescaleDB on your server.
4. Configure Grafana
In a web browser, visit http://<ip-of-your-server>:3000, and sign in with the default username admin and the default password admin.
Head over to Connections → Add new connection. Search for PostgreSQL and configure the database.
- Name:
timescaledb - Host URL:
timescaledb:5432 - Database name:
homey - Username:
root - Password:
toor - TLS/SSL Mode:
disable - TimescaleDB: Checked
Then click Save & test.
5. Create your first Dashboard
Head over to Dashboards → New → New Dashboard.
Click Add visualization, and select timescaledb as your data source.
Enable the Filter and Order toggles.
Under Table, select homey.
Under Data operations, add two rows, with the Column values of value and time.
Under Filter by column value, add at least device_id and capability_id. Set those to a matching Device ID and Capability ID.
You can find these IDs in the Homey Developer Tools.
Set Order by to time and remove the Limit.
Click Save dashboard, and you can take it from here! ![]()

