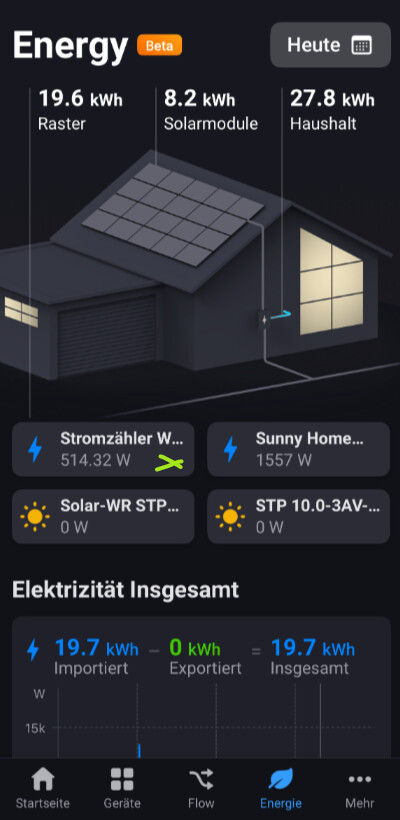
How do I interpret these numbers?
The top left is the grid, that matches my P1 meter. My total consumption.
The top right numer, I’m not sure of. Is it the added total consumption of all my connected devices? If so, how is this higher then the total consumption from my P1 meter? Is something counted more than once? Is something measuring wrong?
If I’ve understood correctly, this new Homey device is nothing more than a simple Shelly 3EM, a device that anyone interested in measuring their electricity consumption has had for many years anyway.
Is it possible to give a device the EV property so that it comes up in the Energy overview? If you have a non-official app for your rechargeable car, it does not come into the overview properly.
I currently have a S0 gateway from SmartGateways that I use to measure the power production by my solar panels. But it shows as a device that is consuming power. Will it be possible to edit the property of the S0 gateway so that it shows as energy production in the overview?
Can someone please help me.
I have installed the test version on my iPhone (app version 9.1.0). I have, because I read this here, installed experimental firmware and turned it on. But where can I find this new function now? I don’t understand it at all, I don’t know where it is.
In my test version, that TestFlicht I could see and use dashboards directly. Can someone please help me, thanks!
Am I correct that I should watch out for a beta version? I just read from someone that it is not smart to perform an experimental update because it can go wrong.
I understand this feature is very much a work in progress. But I do have some questions and thoughts:
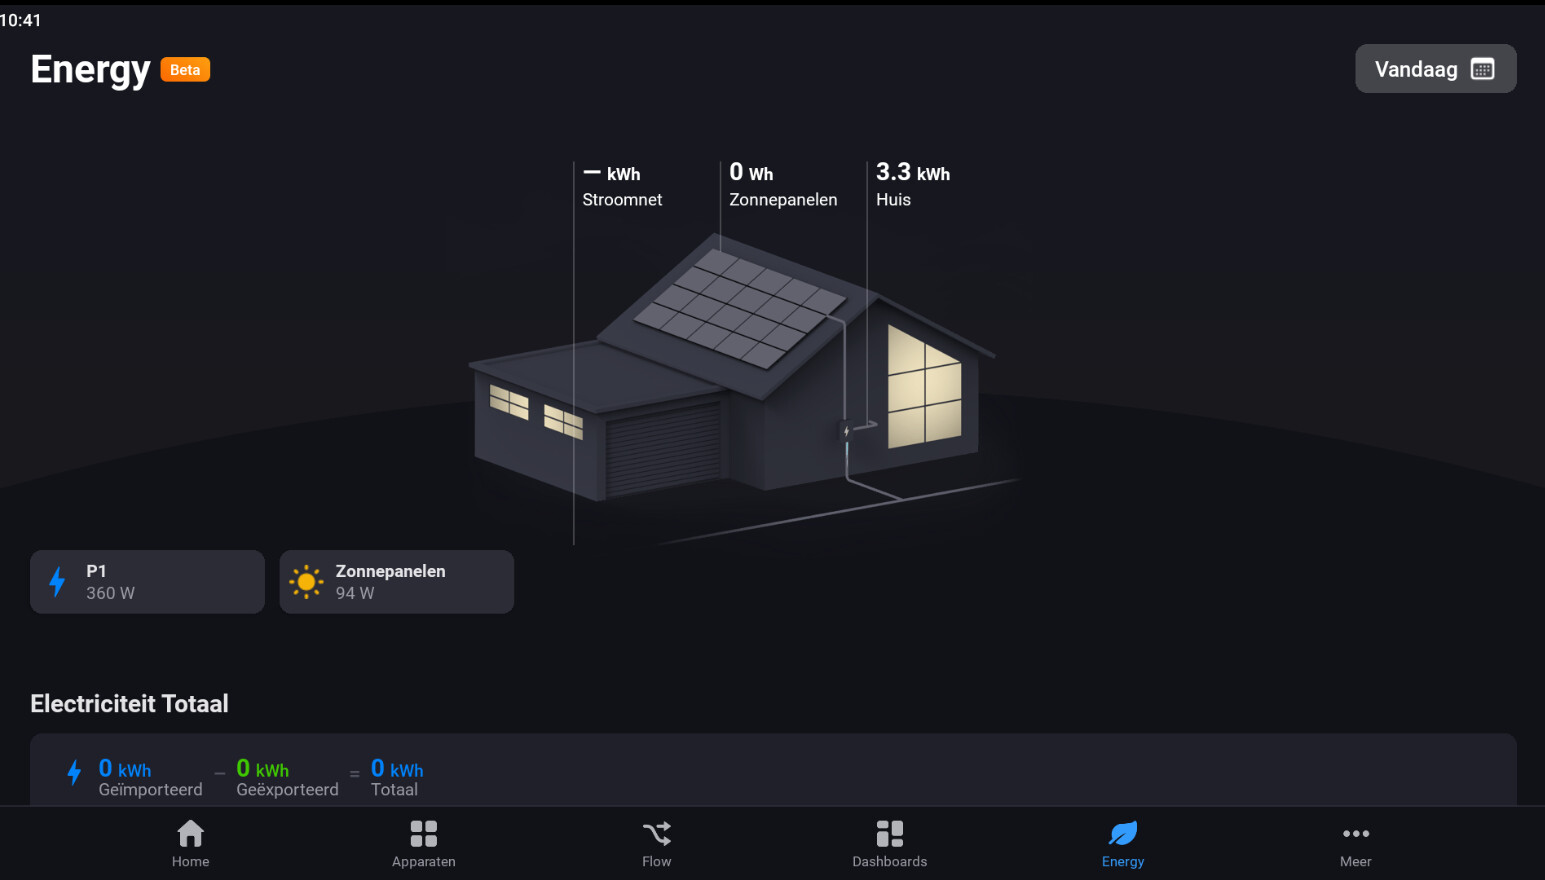
We have an informal care home on our premises. This house has a seperate homewizard power meter, which can show negative ofcourse if their solar panels are working. They have their own solar panels too. Their mains are connected to our main smart meter with a p1 dongle (also homewizard). This all is a bit confusing for Homey I think. I’m not sure how to handle this.
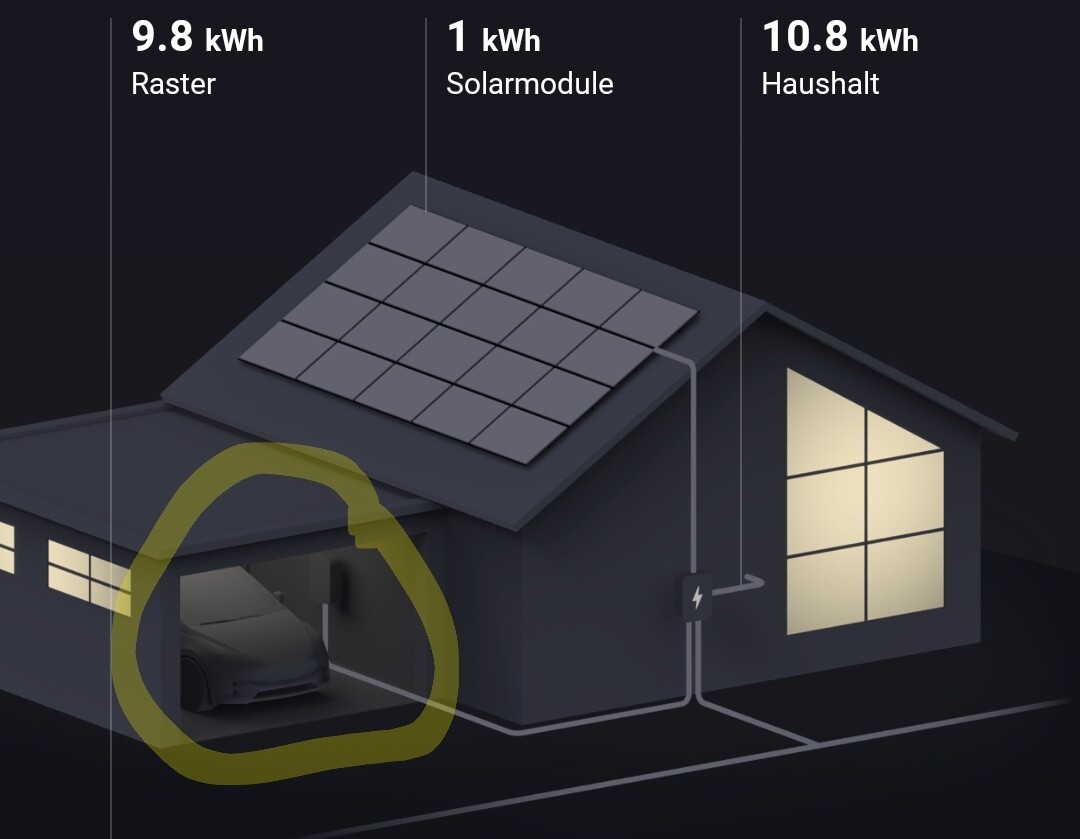
Second, my EV car and EV charger isn’t showing up as such in the energy tab. Even though both are connected through their respective apps. Is this still a work in progress?
I guess that if you add another user with a consumption of 10Wh both will display at 50%, I think the sum of that list is 100%. Add more users and you’ll see that the sum of their respective consumption will add up to 100%. It is not 100% of your house consumption but 100% of the list.
EDIT: Whether that is the intention I am not sure.
I did indeed come to the realisation already that that’s what happening currently. You could make argument for either reference point, but for me personally it would make more sense as a percentage of my entire home’s usage.
So if it’s indeed intended to be the percentage of the ‘grootverbruikers’, I’d argue that it might be a good idea that the reference point would be a setting. So the percentage is either in reference of the entire house or in reference to the connected devices that report their usage.
I have this in Grafana (Homey Pro 23 => InfluxDB => Grafana). It is also a distribution of all my monitored consumers, and it adds up to 100% of course
It is the same but more “visual”.
I have Solax hybrid inverter connected to homey. As there’s no ability to classify devices or the metrics for components within devices my energy tab is currently useless.
As an example you can see the pv graph and current reading is correct but the generated is then labelled which is incorrect as this metric includes power supplied by the battery but no way of correctly attributing measures.
I also have a bunch of devices incoming from home assistant that represent the CT clamp readings from the emporia energy monitors. (Not supported by homey so have to go through HA) again there’s no way of attributing them into the correct ‘buckets’ of consumption.
The total usage shown is just wrong including charging my battery it’s 27kw not 15