“Homey Energy can monitor electricity, gas & water. Dynamic electricity prices will become available in Q1 2025.”
This was written by @Emile in December last year, it has also been repeated in one of the early Homey podcasts this year. How come dynamic prices for electricity is still not functioning? Very annoying since it would be such nice feature to easily see the costs of different appliances on the energy dashboard?
(I know that there are other apps, but since Homey made this price function included in the Energy dashboard it would be good if it could work there)
Because the developers can’t keep up with the “promises” made I guess.
In the meantime, I"d sugggest to use the great example-for-the-energy-tab community app, Power by the Hour!
I noticed the following behavior on Homey Energy since a couple of updates, both on iOS for iPhone and iPad.
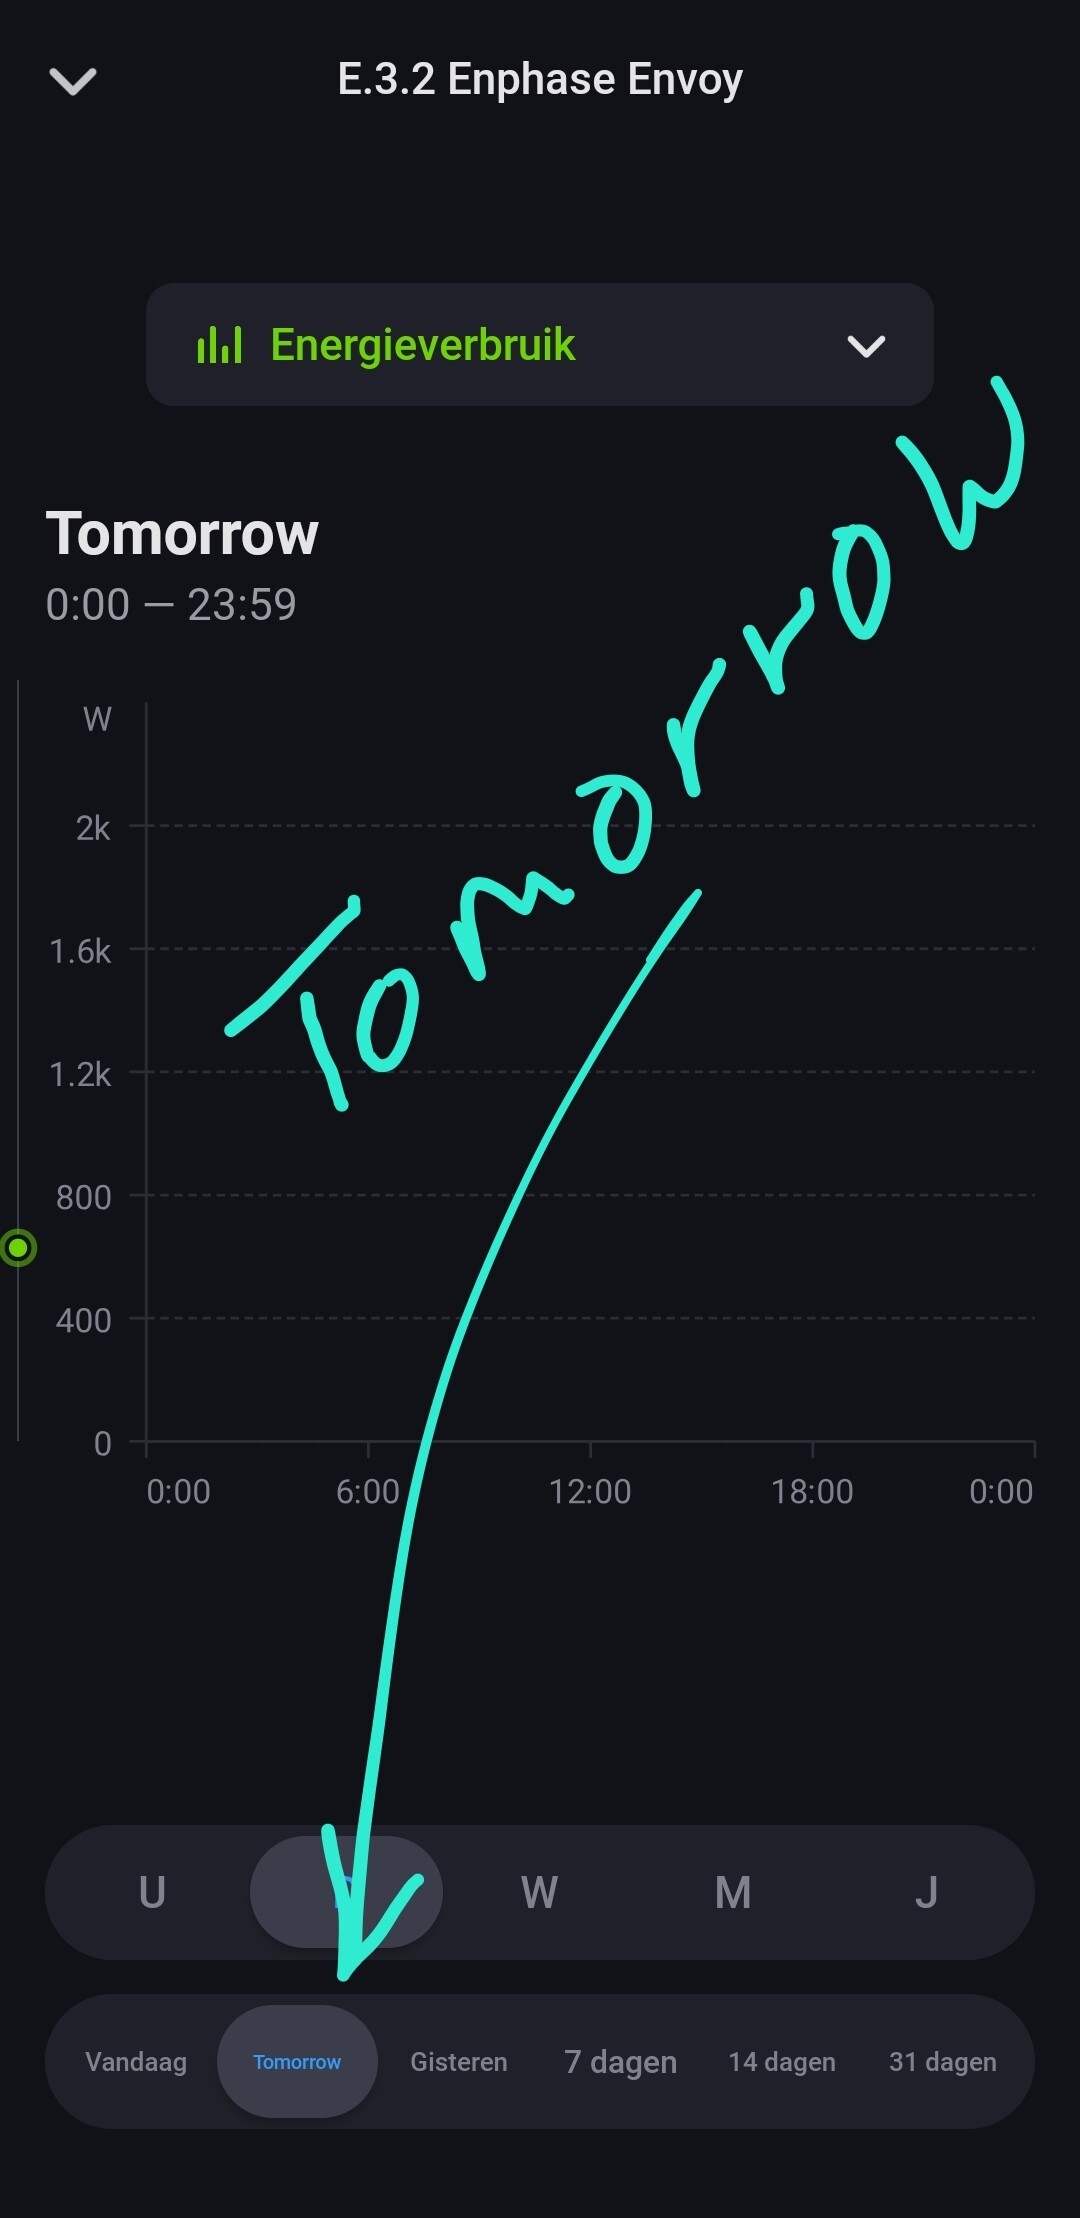
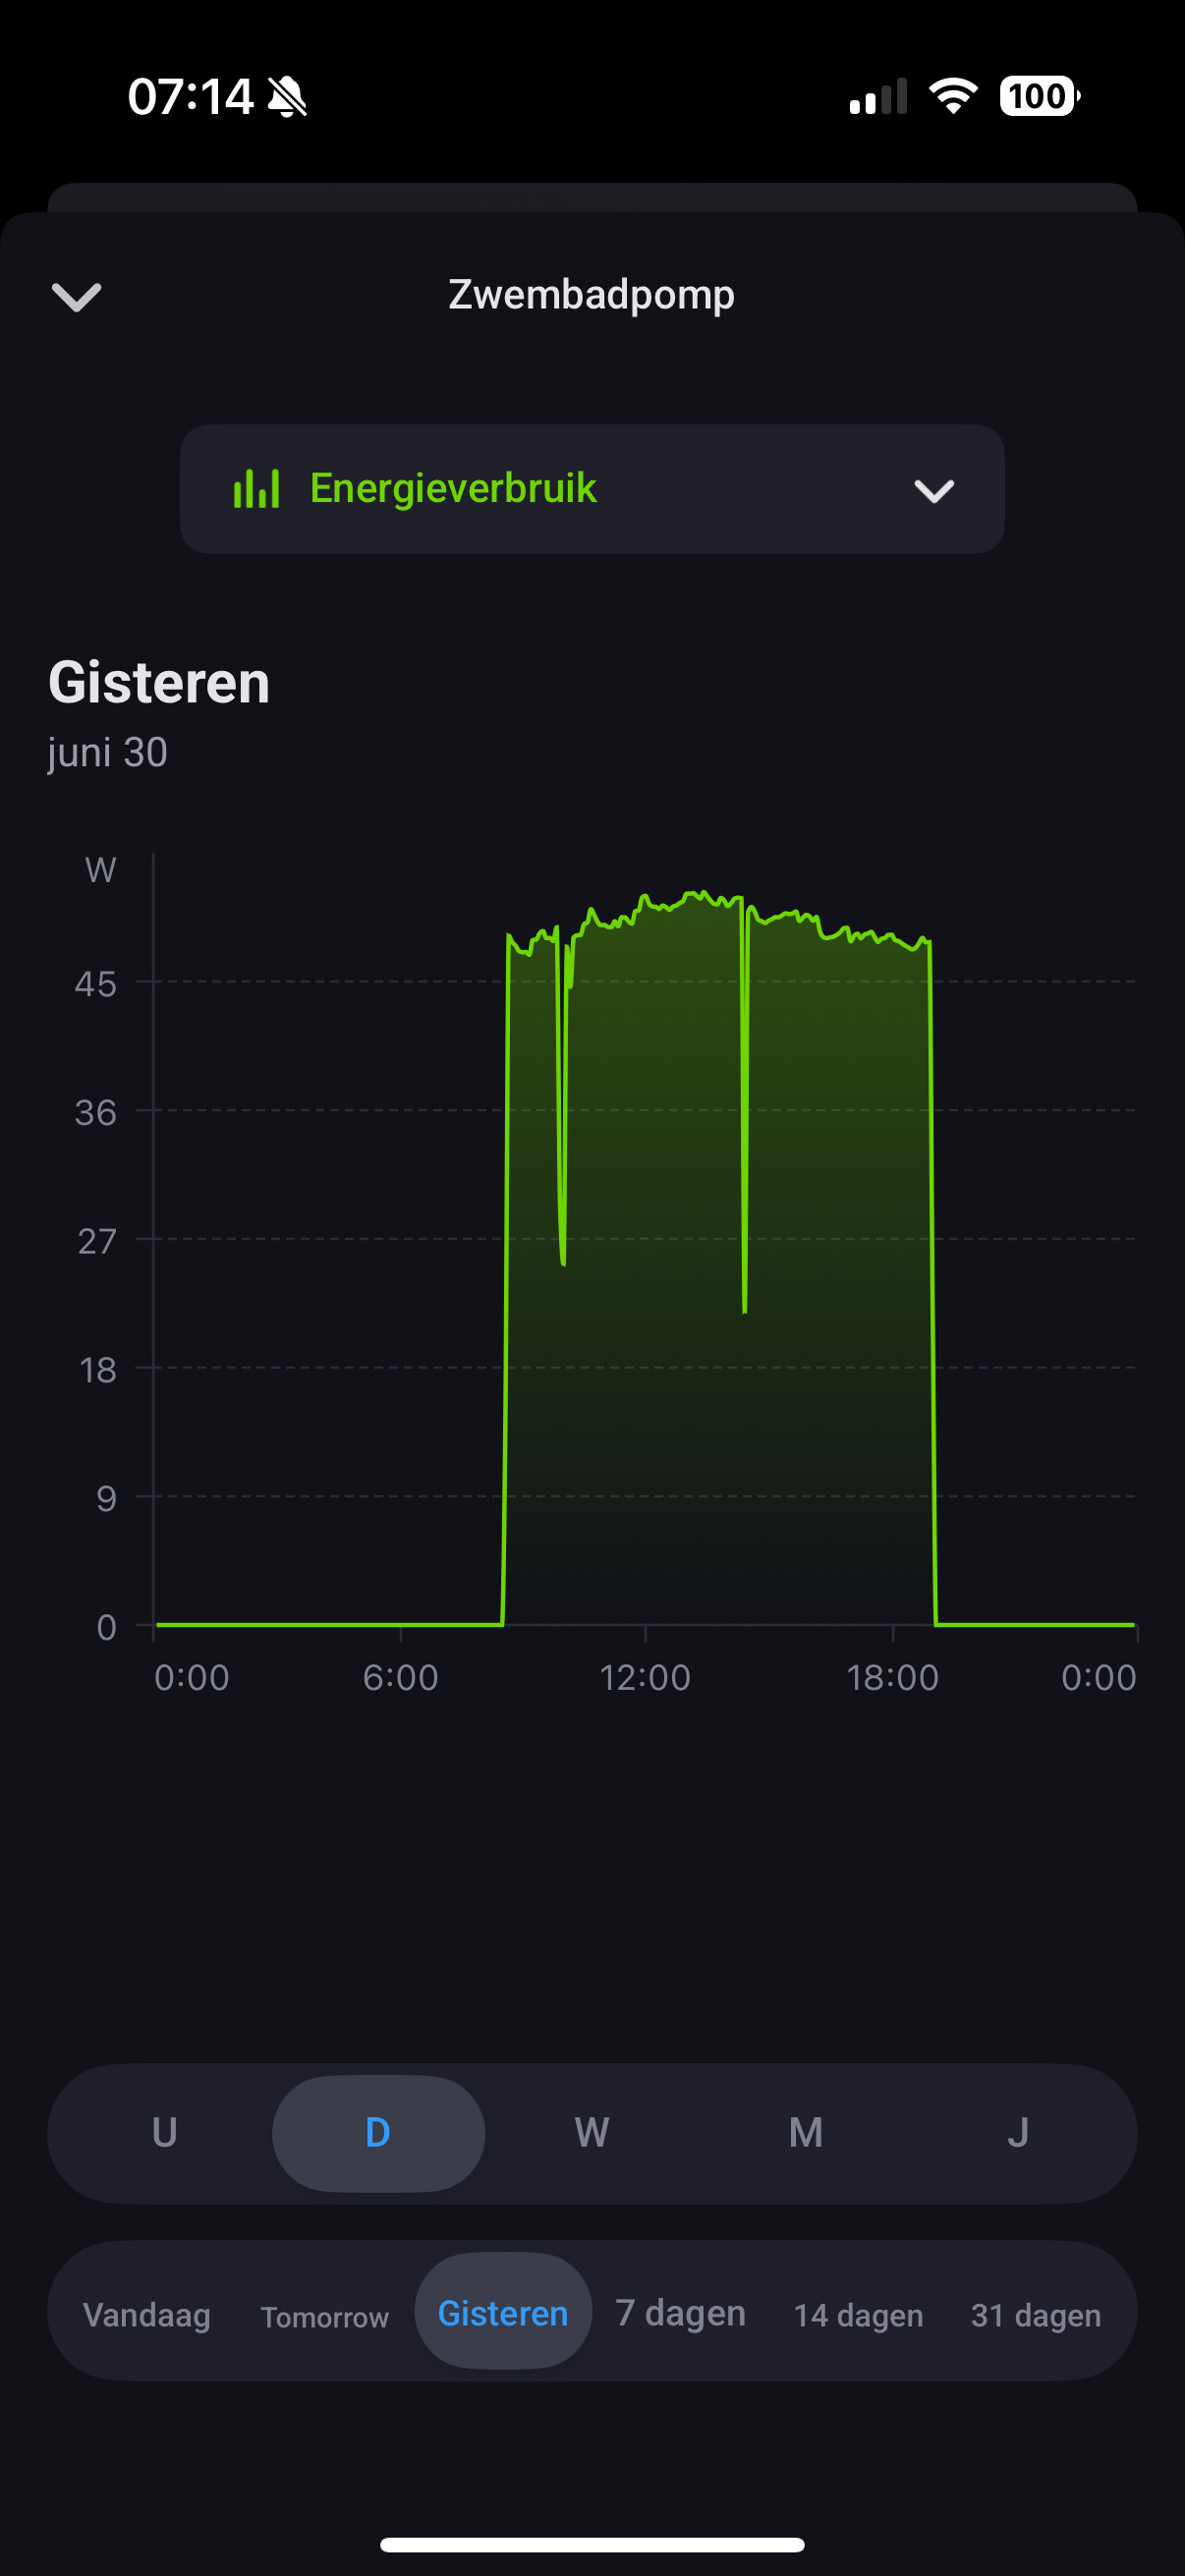
Set on Today, the energy graphs are OK
Changing to yesterday or any day in the past, month, year : the graphs flash for a couple of milliseconds and then remain empty
Swapping to another random app and then back to the Homey app with the Energy page open, the graphs are there, whichever one in the past you choose, they all appear.
EDIT1: It’s not going out of the Homey App that does initiate he correct graphs (other than today) but choosing another tab like “Home”, “Devices” or “Flow” and coming back to “Energy” that initiates the displaying of the correct graphs. EDIT2: It is not even reproducible the way I described above in EDIT1, sometimes it works, sometimes it doesn’t.
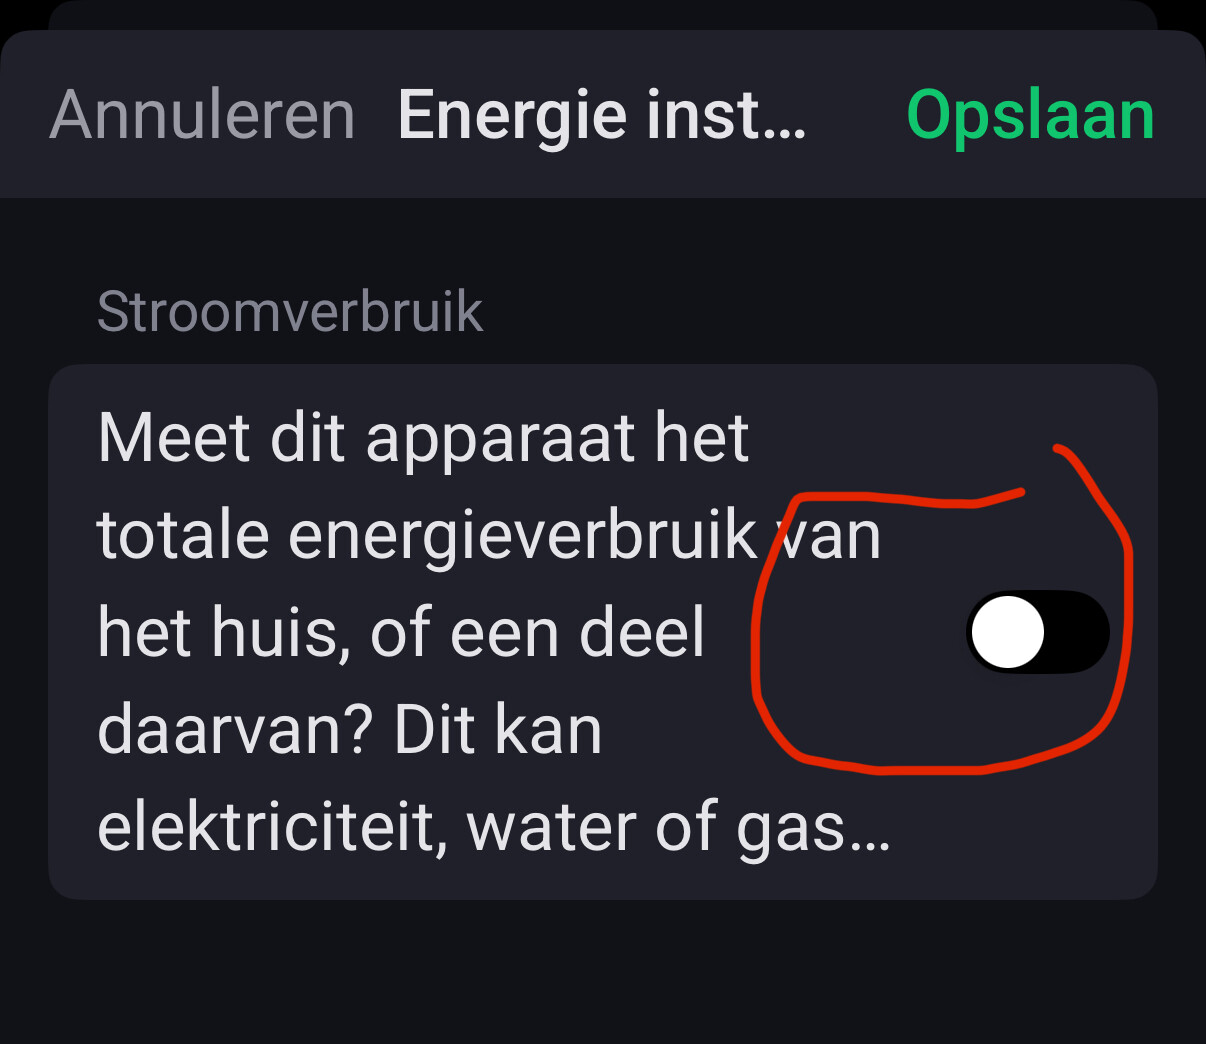
The energy tab look promising. One simple feature request having an all electric house is to have the option to disable the Gas meter section as a whole as it is of no use and only taking up space.
Hi,
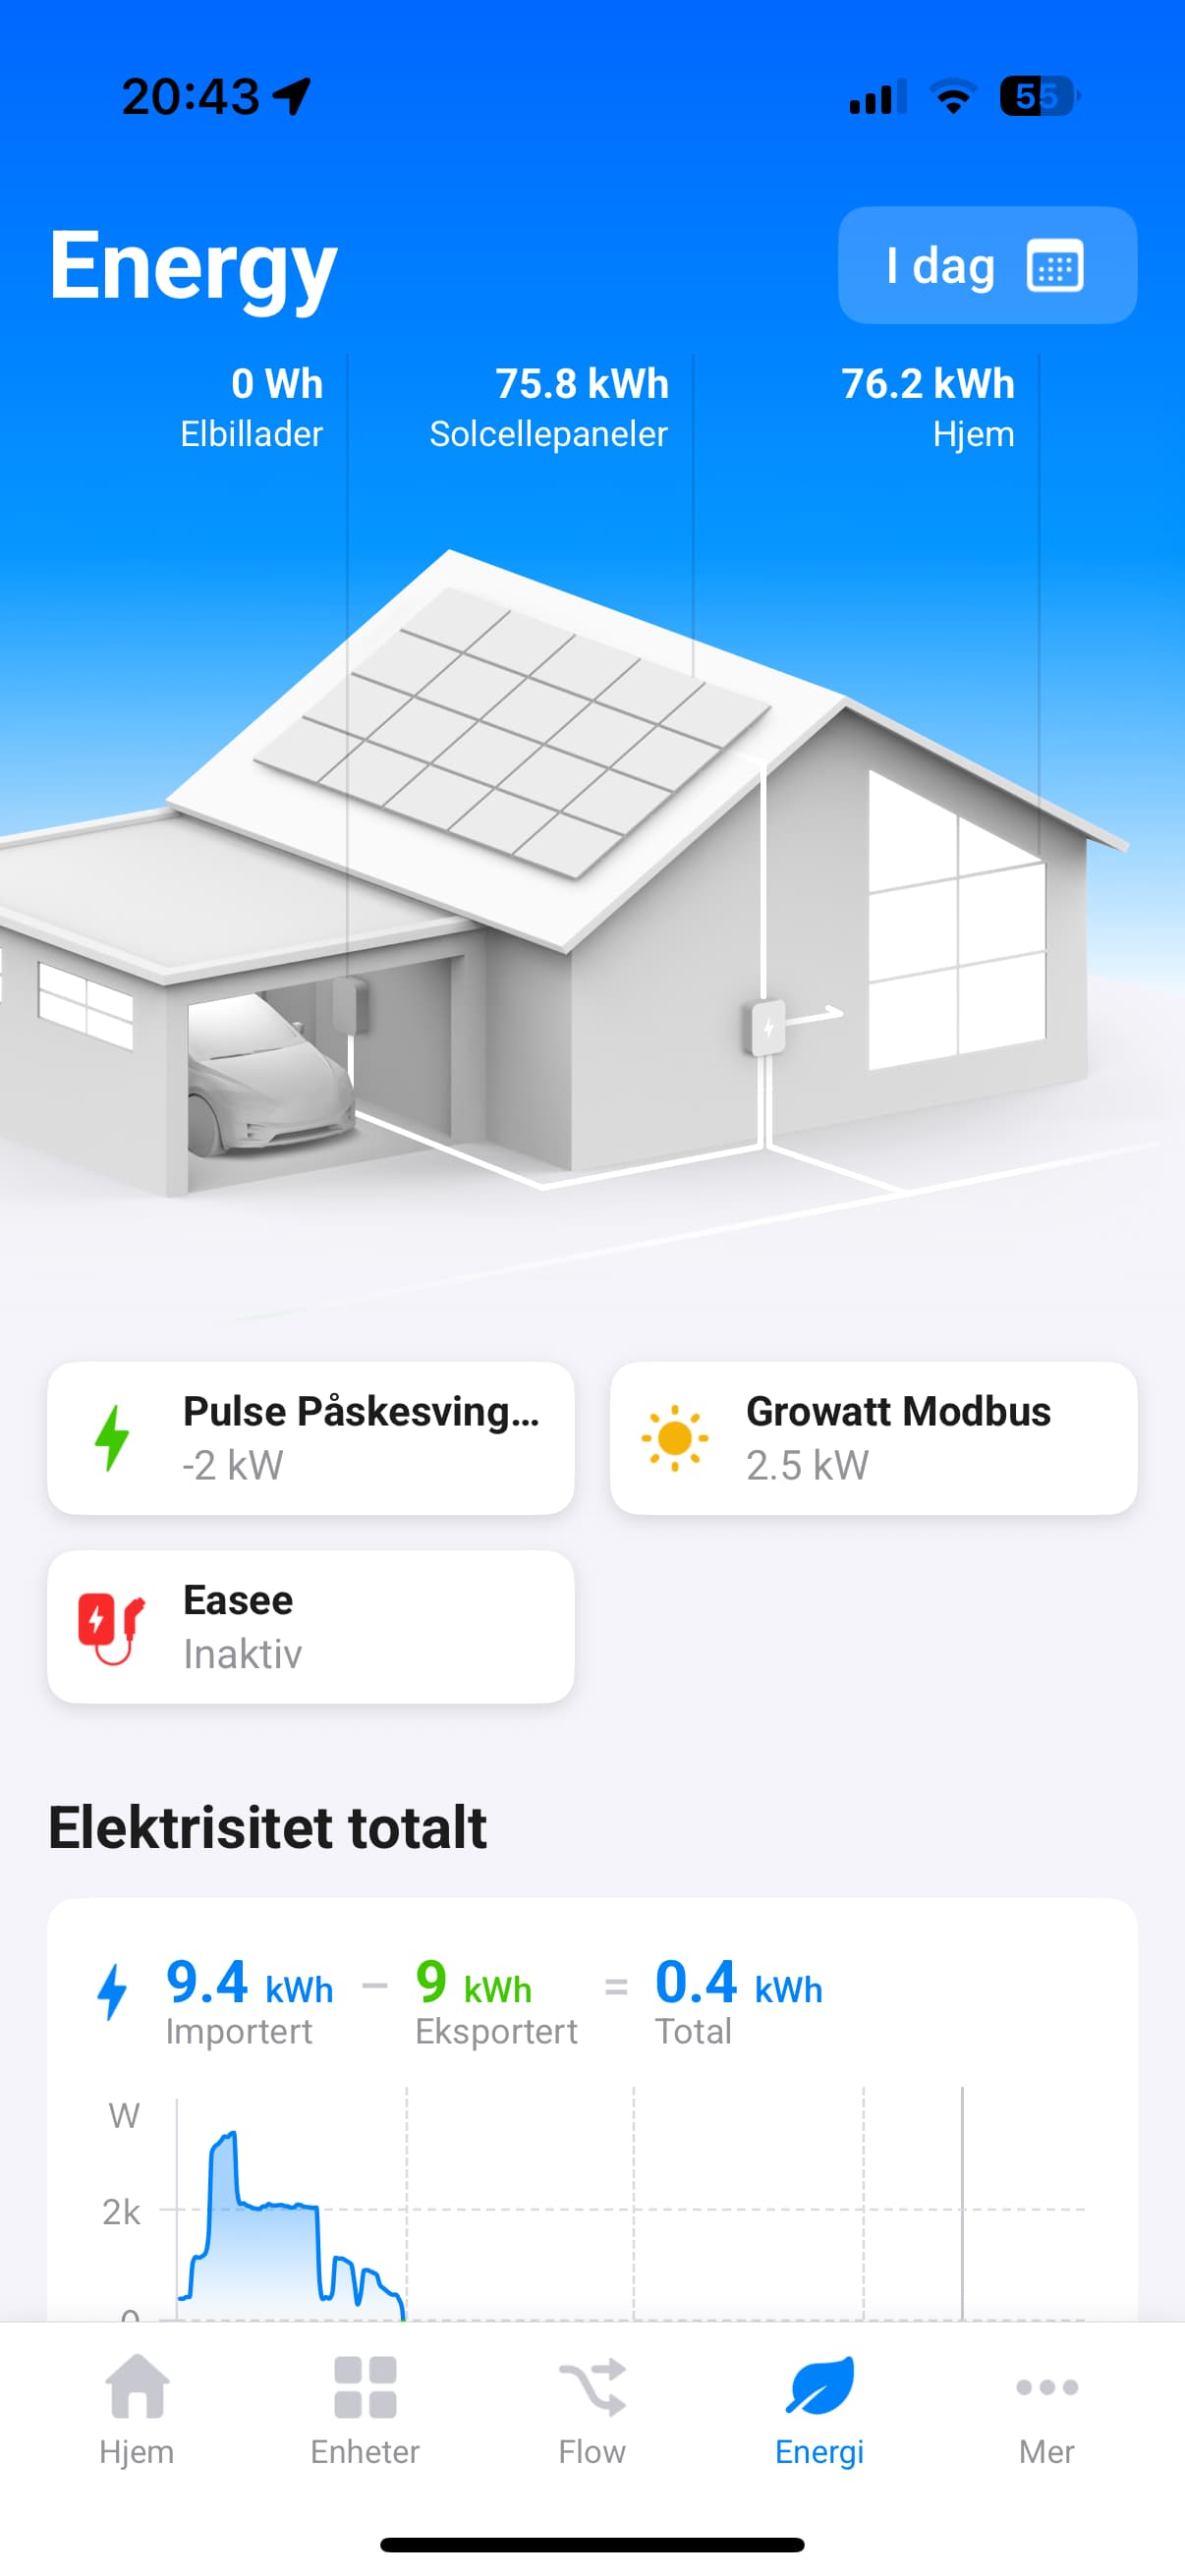
i see i have similar issues like the rest. Where the numbers shown on the energy tab for export does not add up among other things for the energy dashboard.
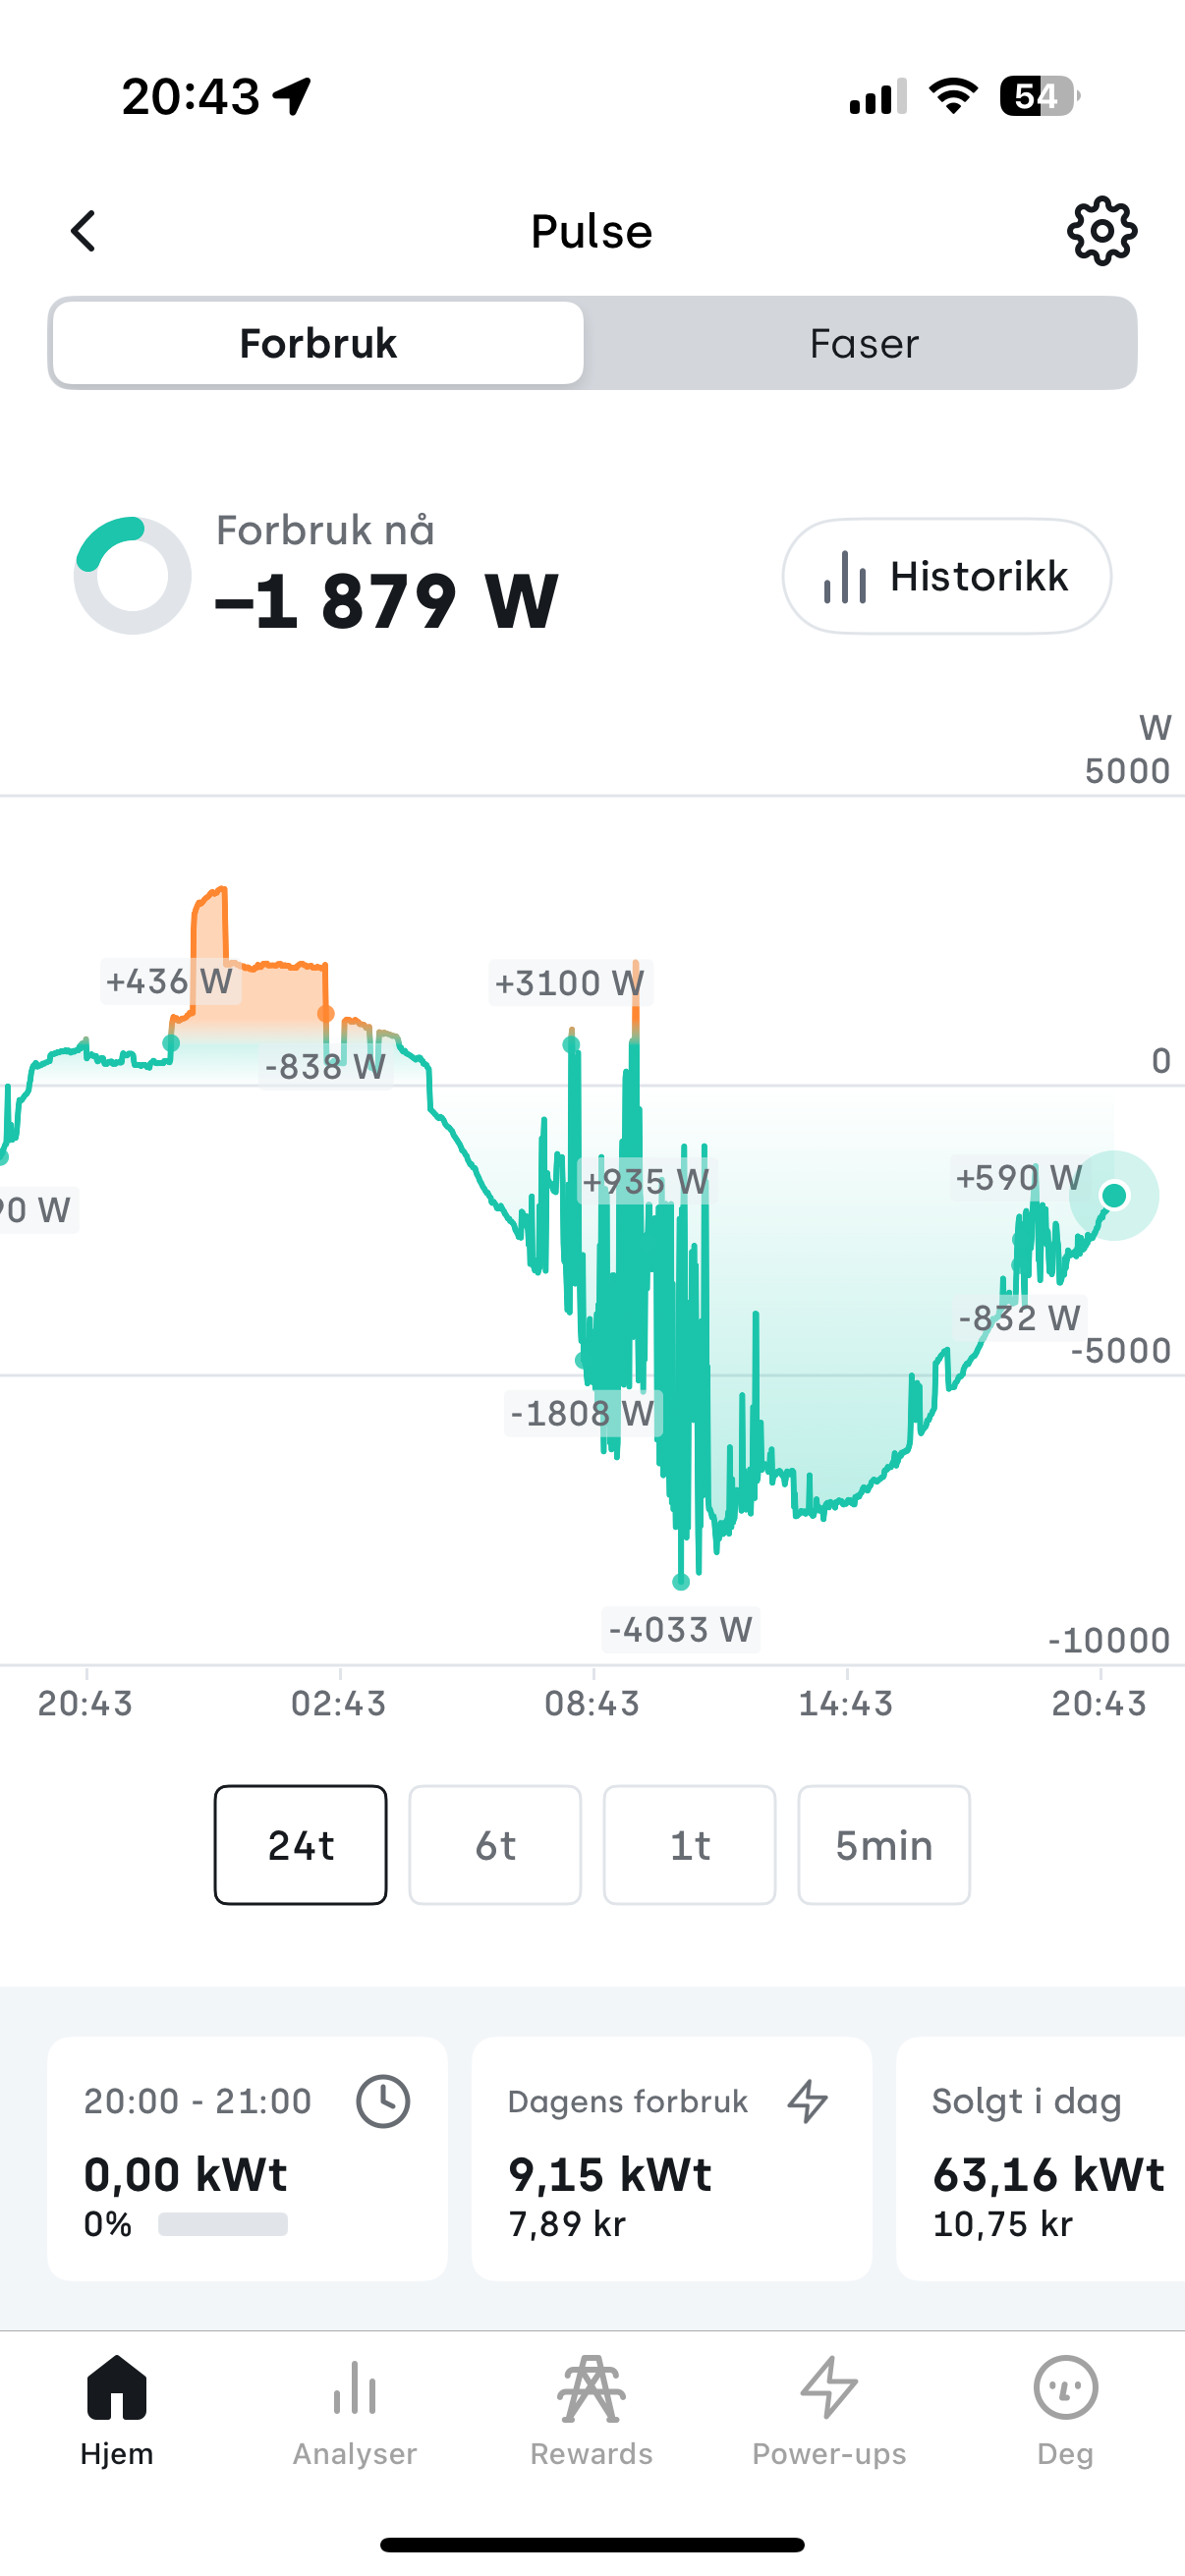
See attached images from Tibber and HP taken in the evening before the day and solar production is over for the day.
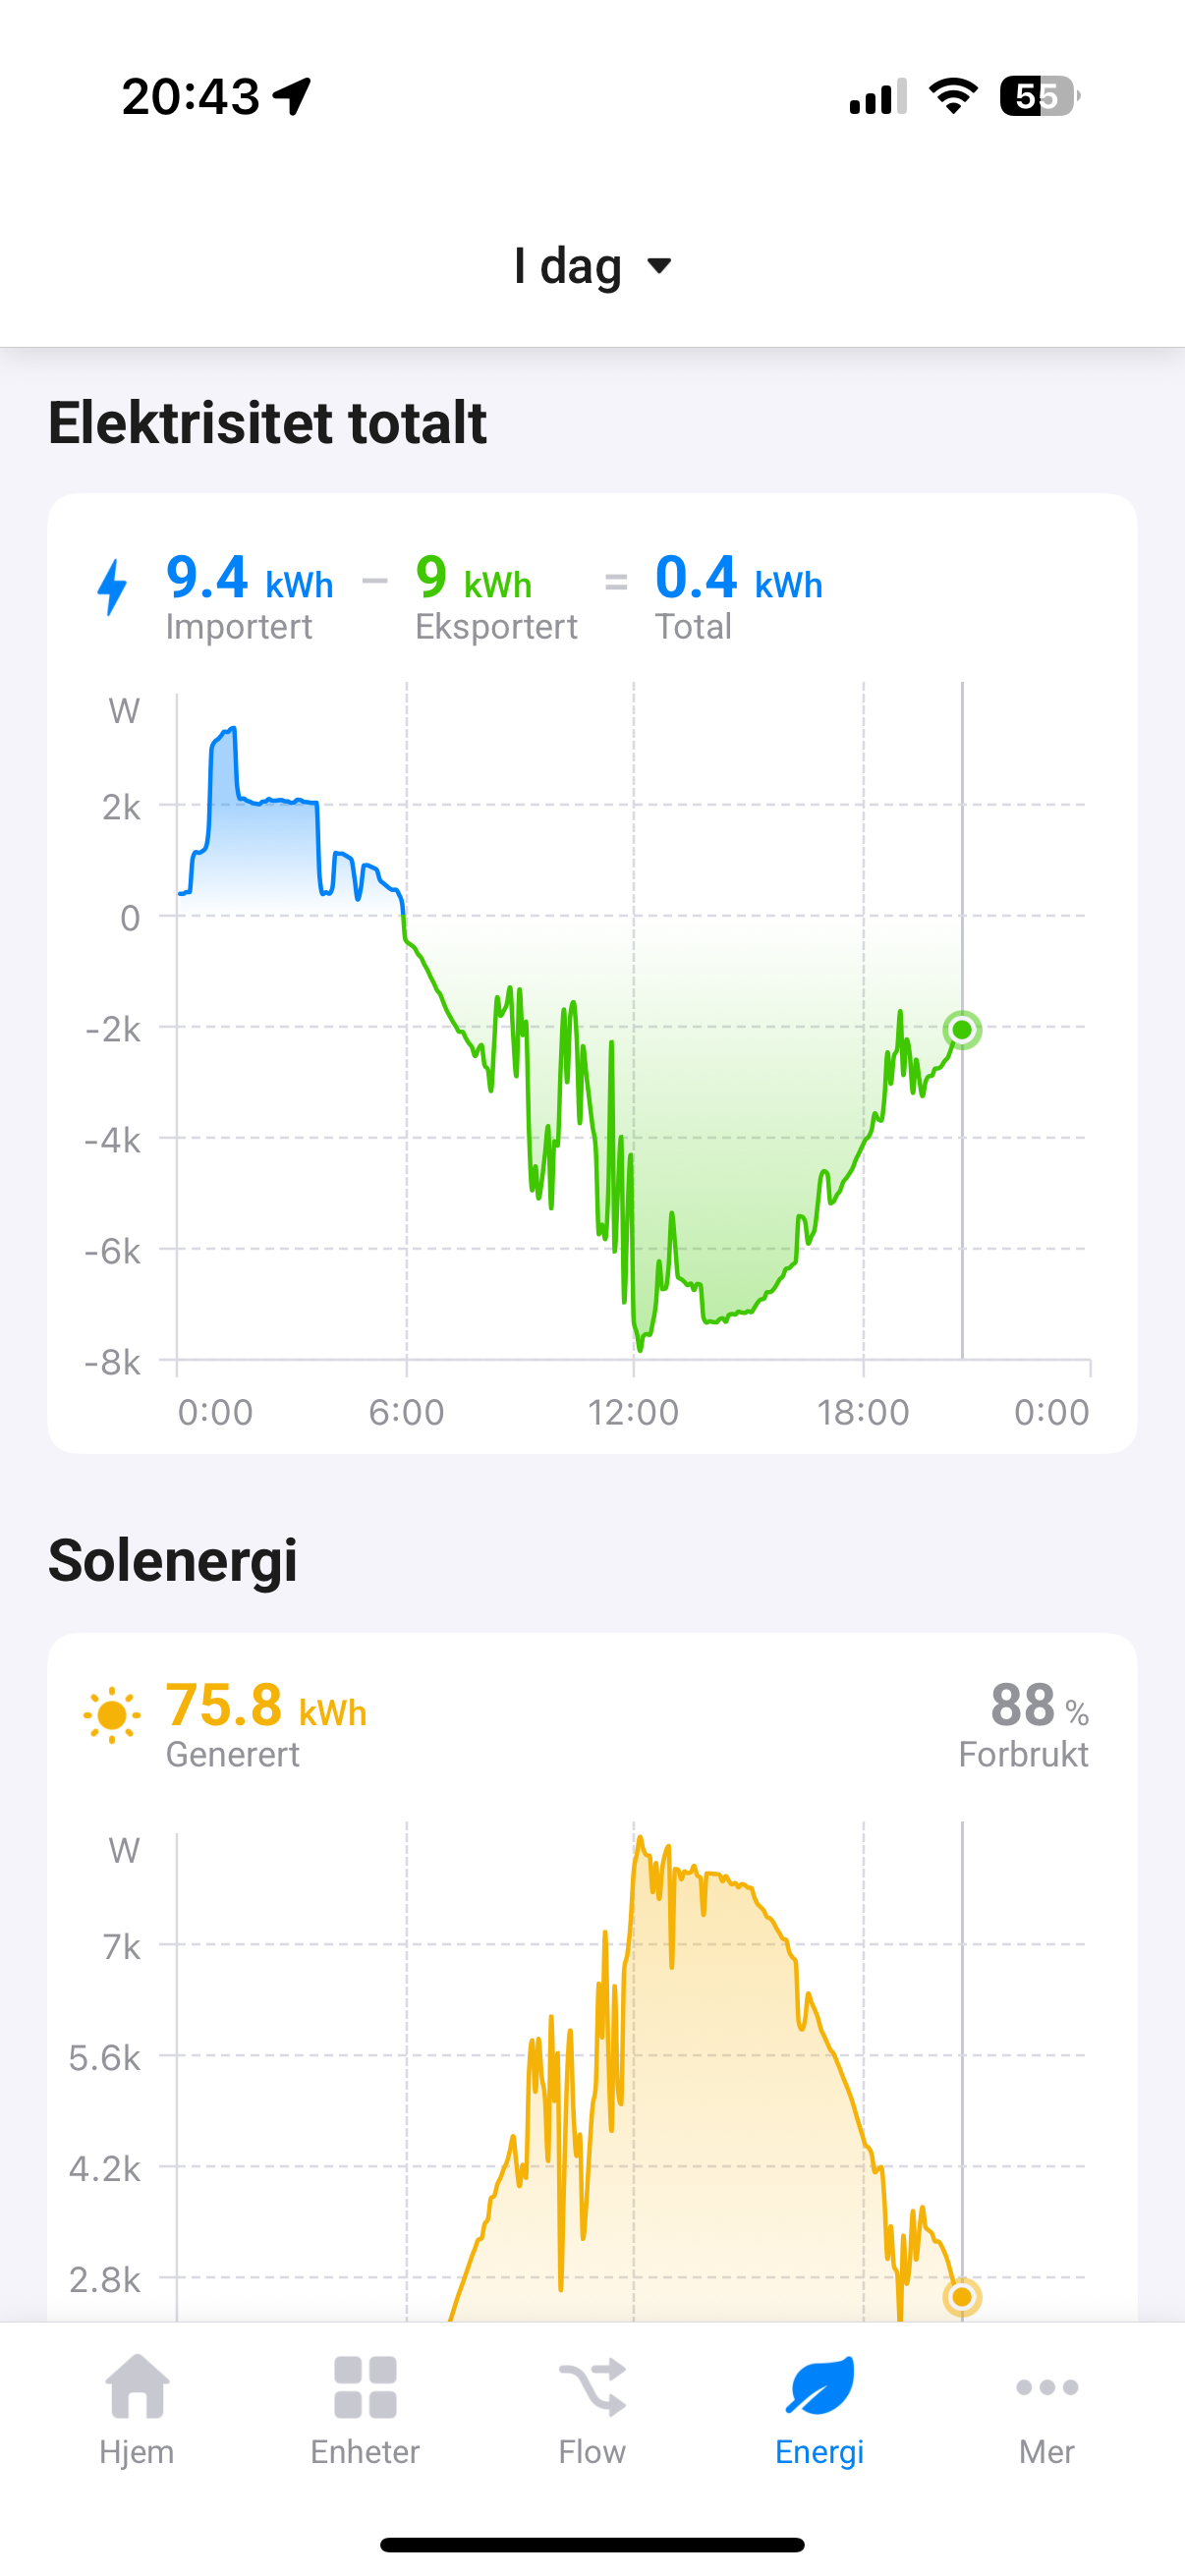
This day i exported 63.16 kWh (from Tibber app) of a production of 75,8 kWh so far that day, why does the Electricity total say that i used 9.4 kWh from the grid and exported 9 kWh.
Something is very strange here…
Should it not show somewhat the same values as the Tibber app?
Export around 63kWh
i expect that there might be some small mismatch between the numbers for alle values between Tibber and the modbus integration as to how or when it is summed in Tibber vs HP. But there is clearly something off her.
Where do one start to debug/fix this as i really think this page has potential. It just needs to start showing the correct values first
HW list:
Tibber pulse via the Tibber app
Growatt solar inverter modbus using the SolarEdge + Growatt TCP modbus app
I also have 2x Shelly pro 3 Em, 1 one the solar circuit and the other one on the main fuse into the house. However i do not use those into energy for now. They are bot excluded from energy in their settings.
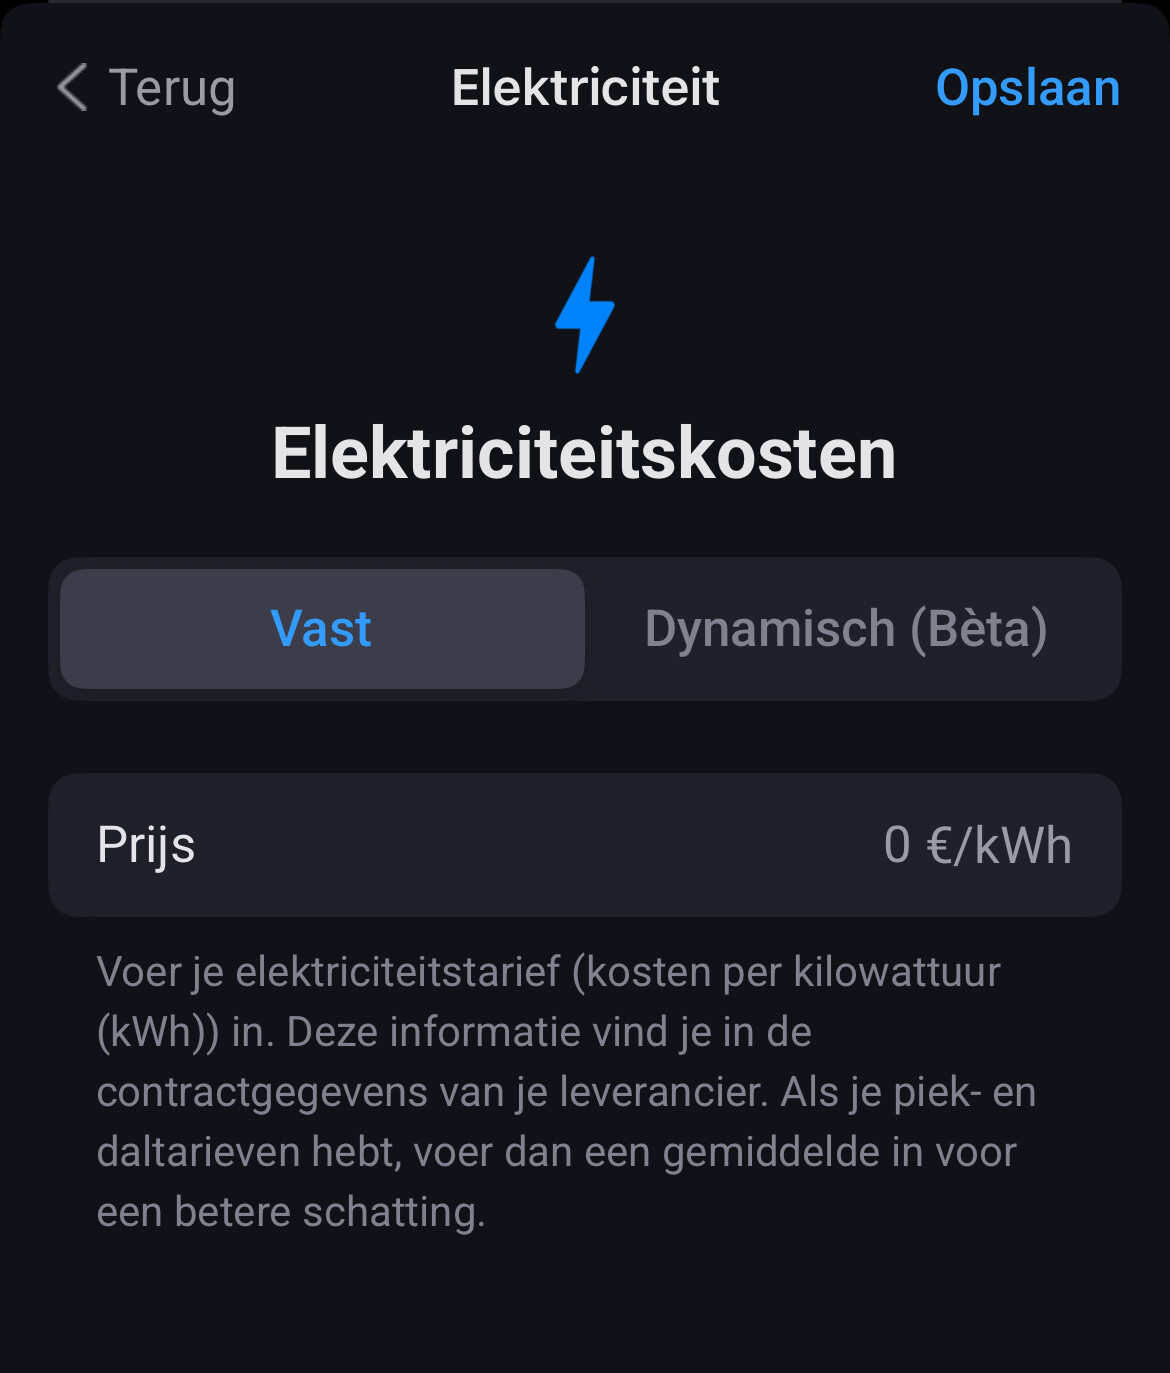
Is there any further information available about the dynamic energy tariffs? In the app, there is now a “beta” label at the input button (which, by the way, doesn’t work). Previously, there was a message saying it would be available “soon.” But now there’s no mention of that — just a button labeled beta that doesn’t work.
Hello there, I’m using Tibber Pulse to measure my total energy consumption and a Shelly 1PM to measure the energy production (2 solar panels and a Growatt Noah 2000 battery).
Unfortunately I seem to run into similar issues with the Energy tab:
the daily overall consumption is not calculated,
the daily total energy export is not calculated,
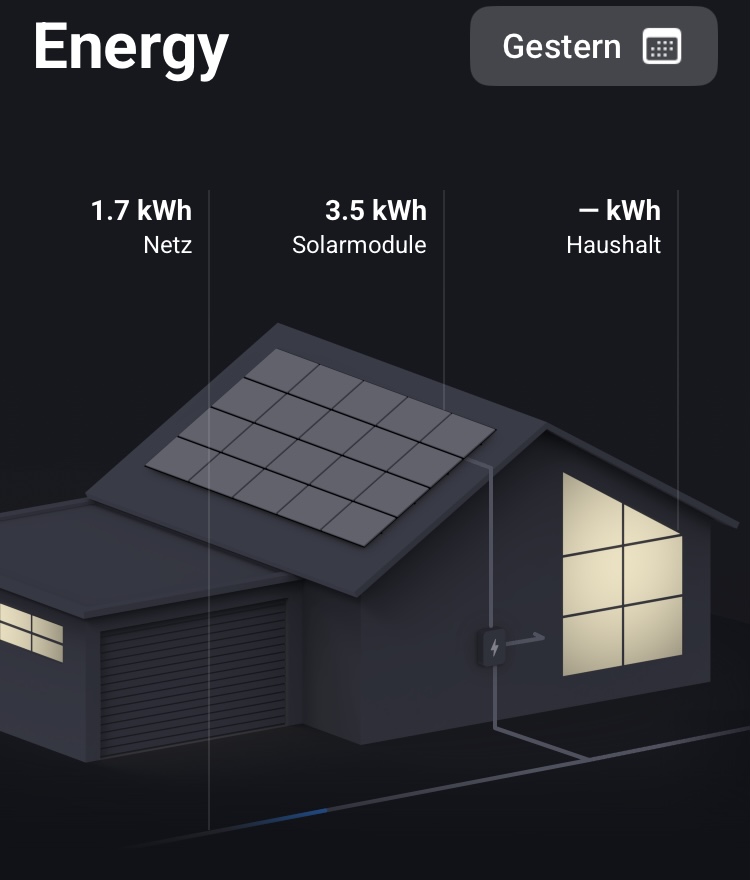
the daily total % of my solar production, that I consumed myself, is always shown as 100%,
although - when scrolling through the data points - the system seems to have data showing less than 100%.
Your 1st solar chart is showing 3,5kWh. Isn’t that the production?
Acn you please check your Pulse device if it reports the eypirted energy meter (kWh). That is needed. If your energy meter does not provide this data (only import), then you have to ask the meter manunacturer how to activate this reporting.
Based on your screenshot, you uses 100% of your solarproduction for the day. When you select one point in the chart, it shows your current usage.
I’ve switched from Homey Pro 2016 to 2023 (went all smooth btw!). Now have access to the Energy tab. I do notice that the two relevant energy measurements I have (energy meter total and solar panels total power) are available in the energy tab, measurement are still shown in the device details.
But, the two are not captured in insights anymore. This is already the case for roughly 1 day.
Historic values from my 2016 are still available, but none added since installing 2023. Homey reboots, App restarts and PtP for a minute do to solve this.
Might this be a known issue (couldn’t find info about this, except for Power in insights stopped update after upgrade )? => (update) known issue, see other thread. Some insights have different names which only work properly after reinstalling the device.