Hello,
The IOBroker adapter has “20,000” data points.
That’s far too many for the average consumer.
So I’m in the right place. I like it.
Note:
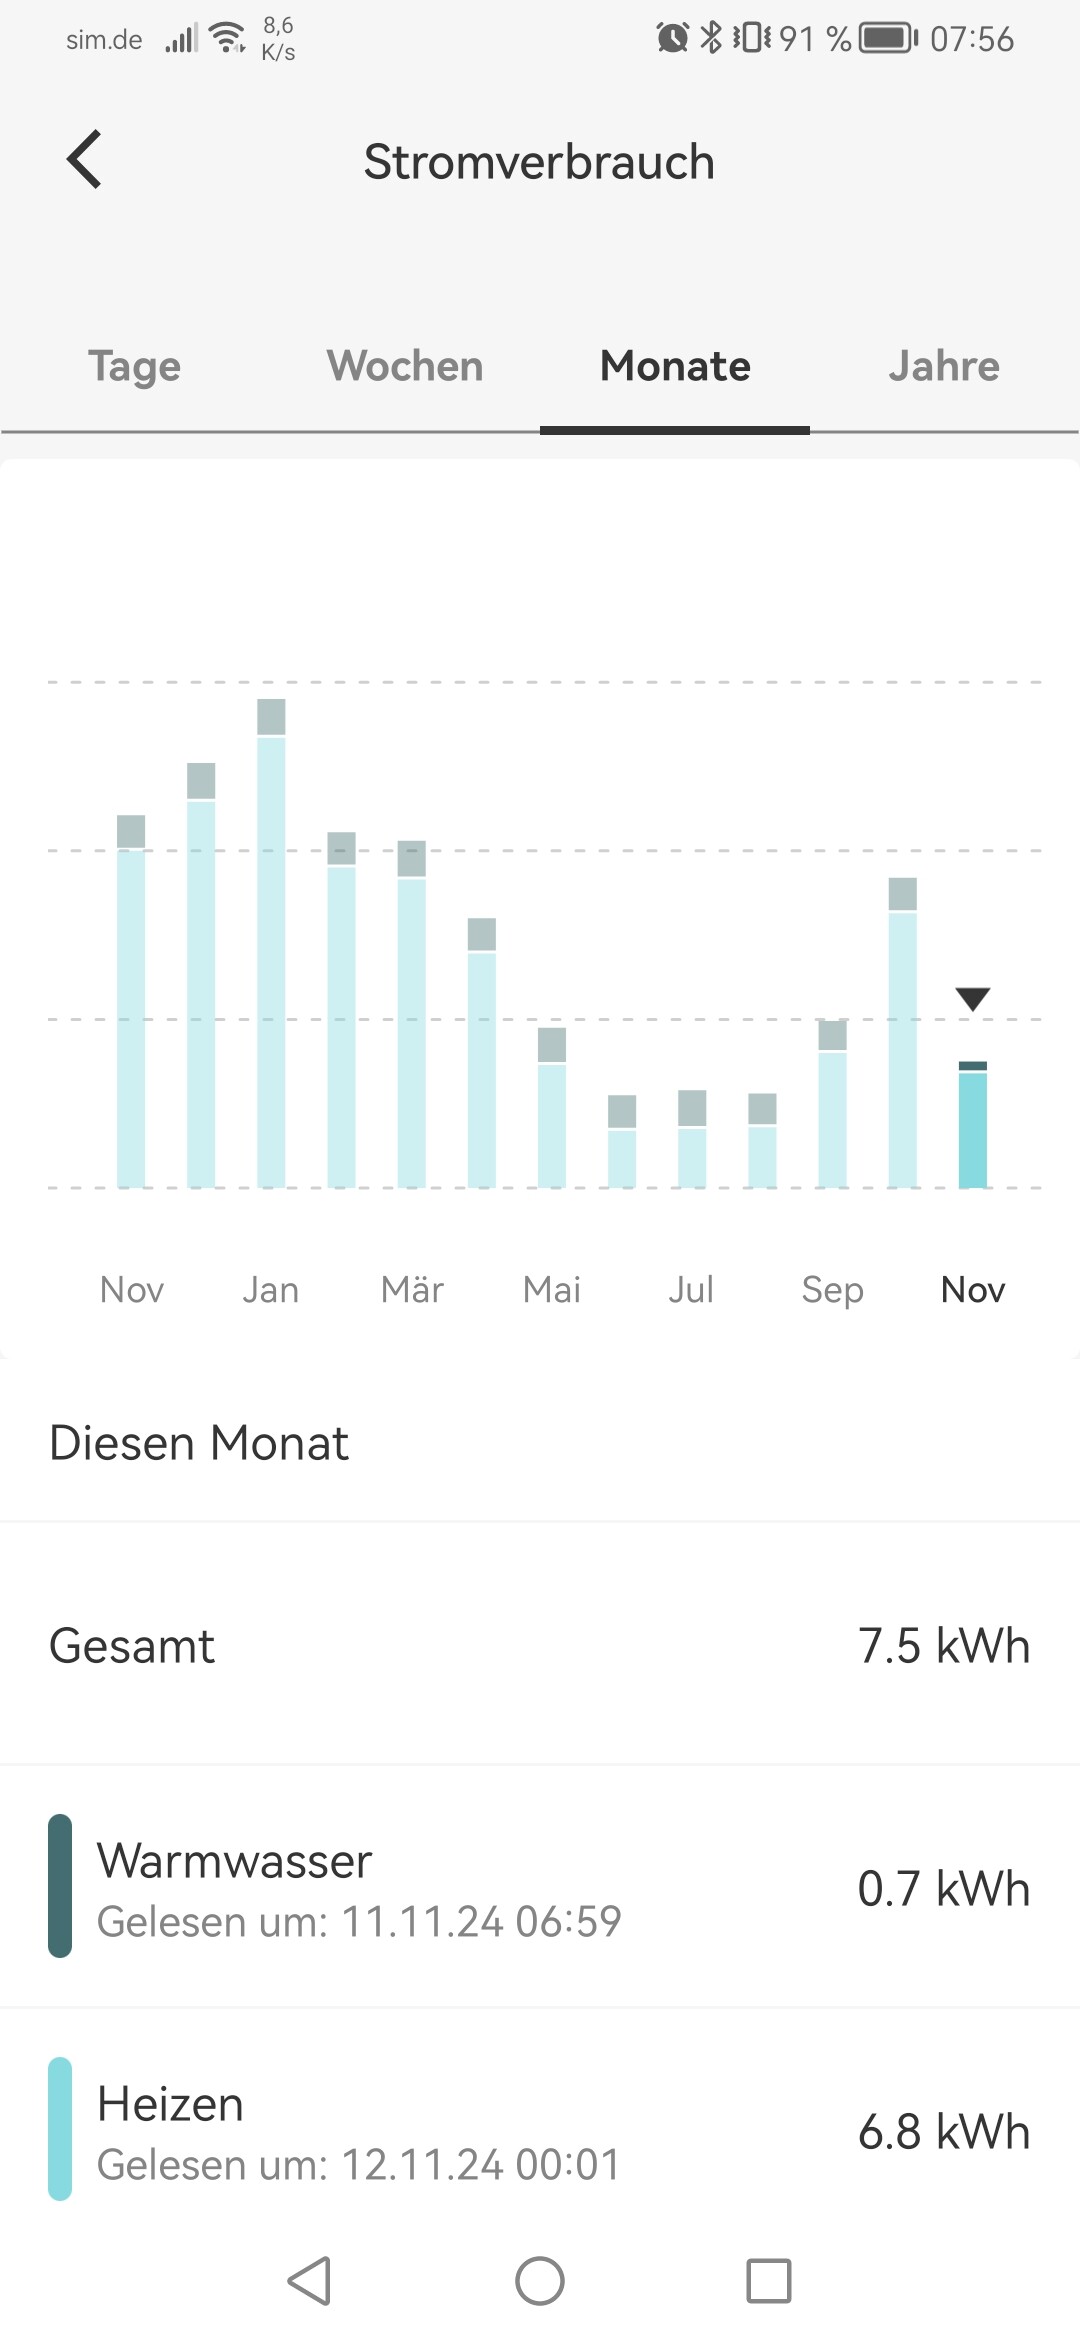
I don’t have any values for energy - maybe that’s because the values are usually under 1 kWh?
I don’t have any values for boiler either.
Hi,
I find the values in kWh as reported by Viessmann to be approximative at best.
It is my conviction they are guesstimated rather than anything else.
Hello,
yes, I know that, but if this data point exists, there should be something in it.
I’ve already contacted Kenny.
Perhaps he should use the total electrical consumption instead.
There are two consumption values.
I was just making a statement that you really shouldn’t trust the kWh values as presented by your Viessmann heater. And it doesn’t matter if you sum them up or not. The Viessmann values are way off. And I mean: Waaaaay off.
Morning, I have been manually reading the electricity, gas and water meter readings every Sunday morning since 2000.
The annual consumption (cubic meter) in the ViCare app actually matches the manual readings fairly well.
Actually, I personally don’t need the consumption values because I have the vicare app.
For me, the values from the boiler are more important. (Pump, temperatures, etc.)
But the most important thing for me is the function of automatically changing the heating mode when I’m not at home.
Viessmann charges a lot for that!
Interesting!
I have a Vitodens 222W with a B2LB controller. this one for sure is not equipped with a flow sensor. What type do you have? Could it be equipped with a flow sensor?
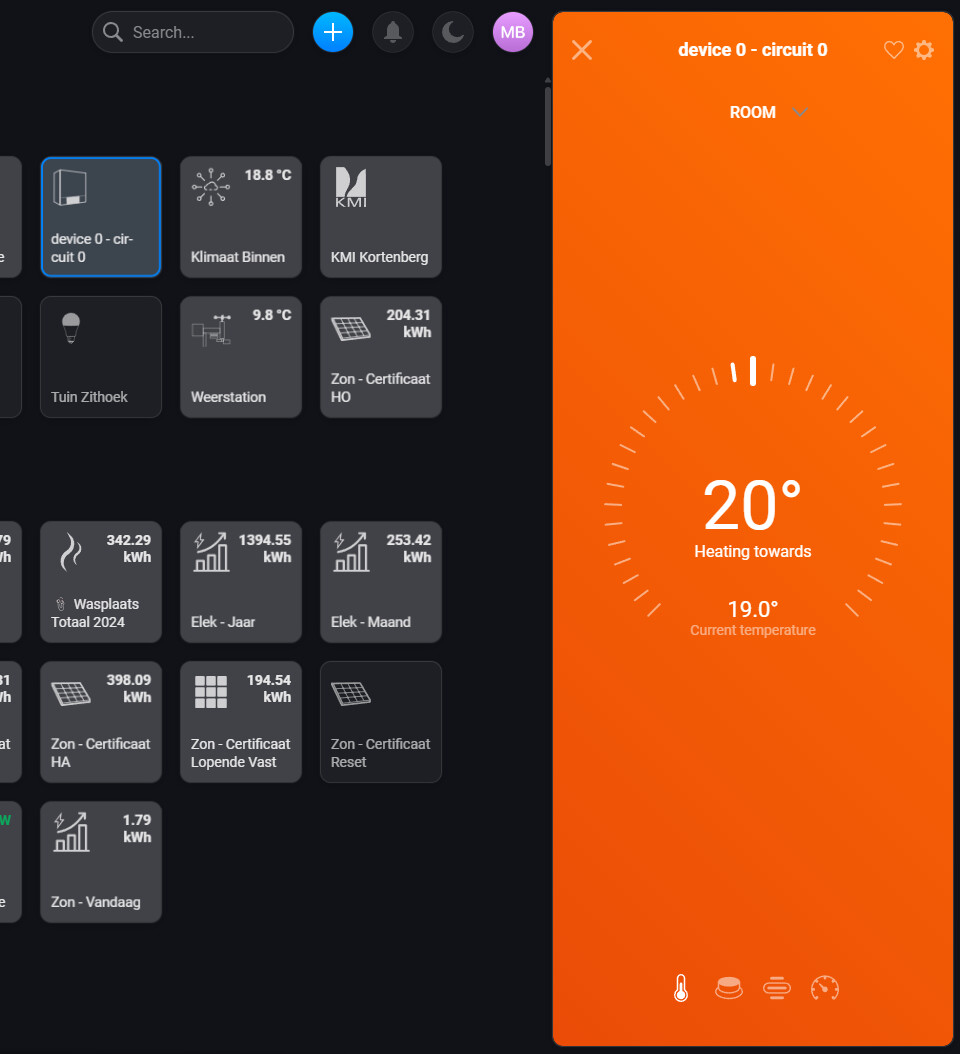
All right, this version seems to do the trick. Works and all possible data populates. The device’s initial name (device 0 - circuit 0) is a bit off but can off course be changed.
Many thanks for your hard work!
The only difference between the Home Assistant version and yours is that I can immediately see that the system is heating up on the icon itself. See orange color of the temperature. Is this something you can force as well? I’ve put both versions next to another. Set temp is 20°C and orange means it is heating towards that setting.
hello,
something isn’t working with the kWh yet.
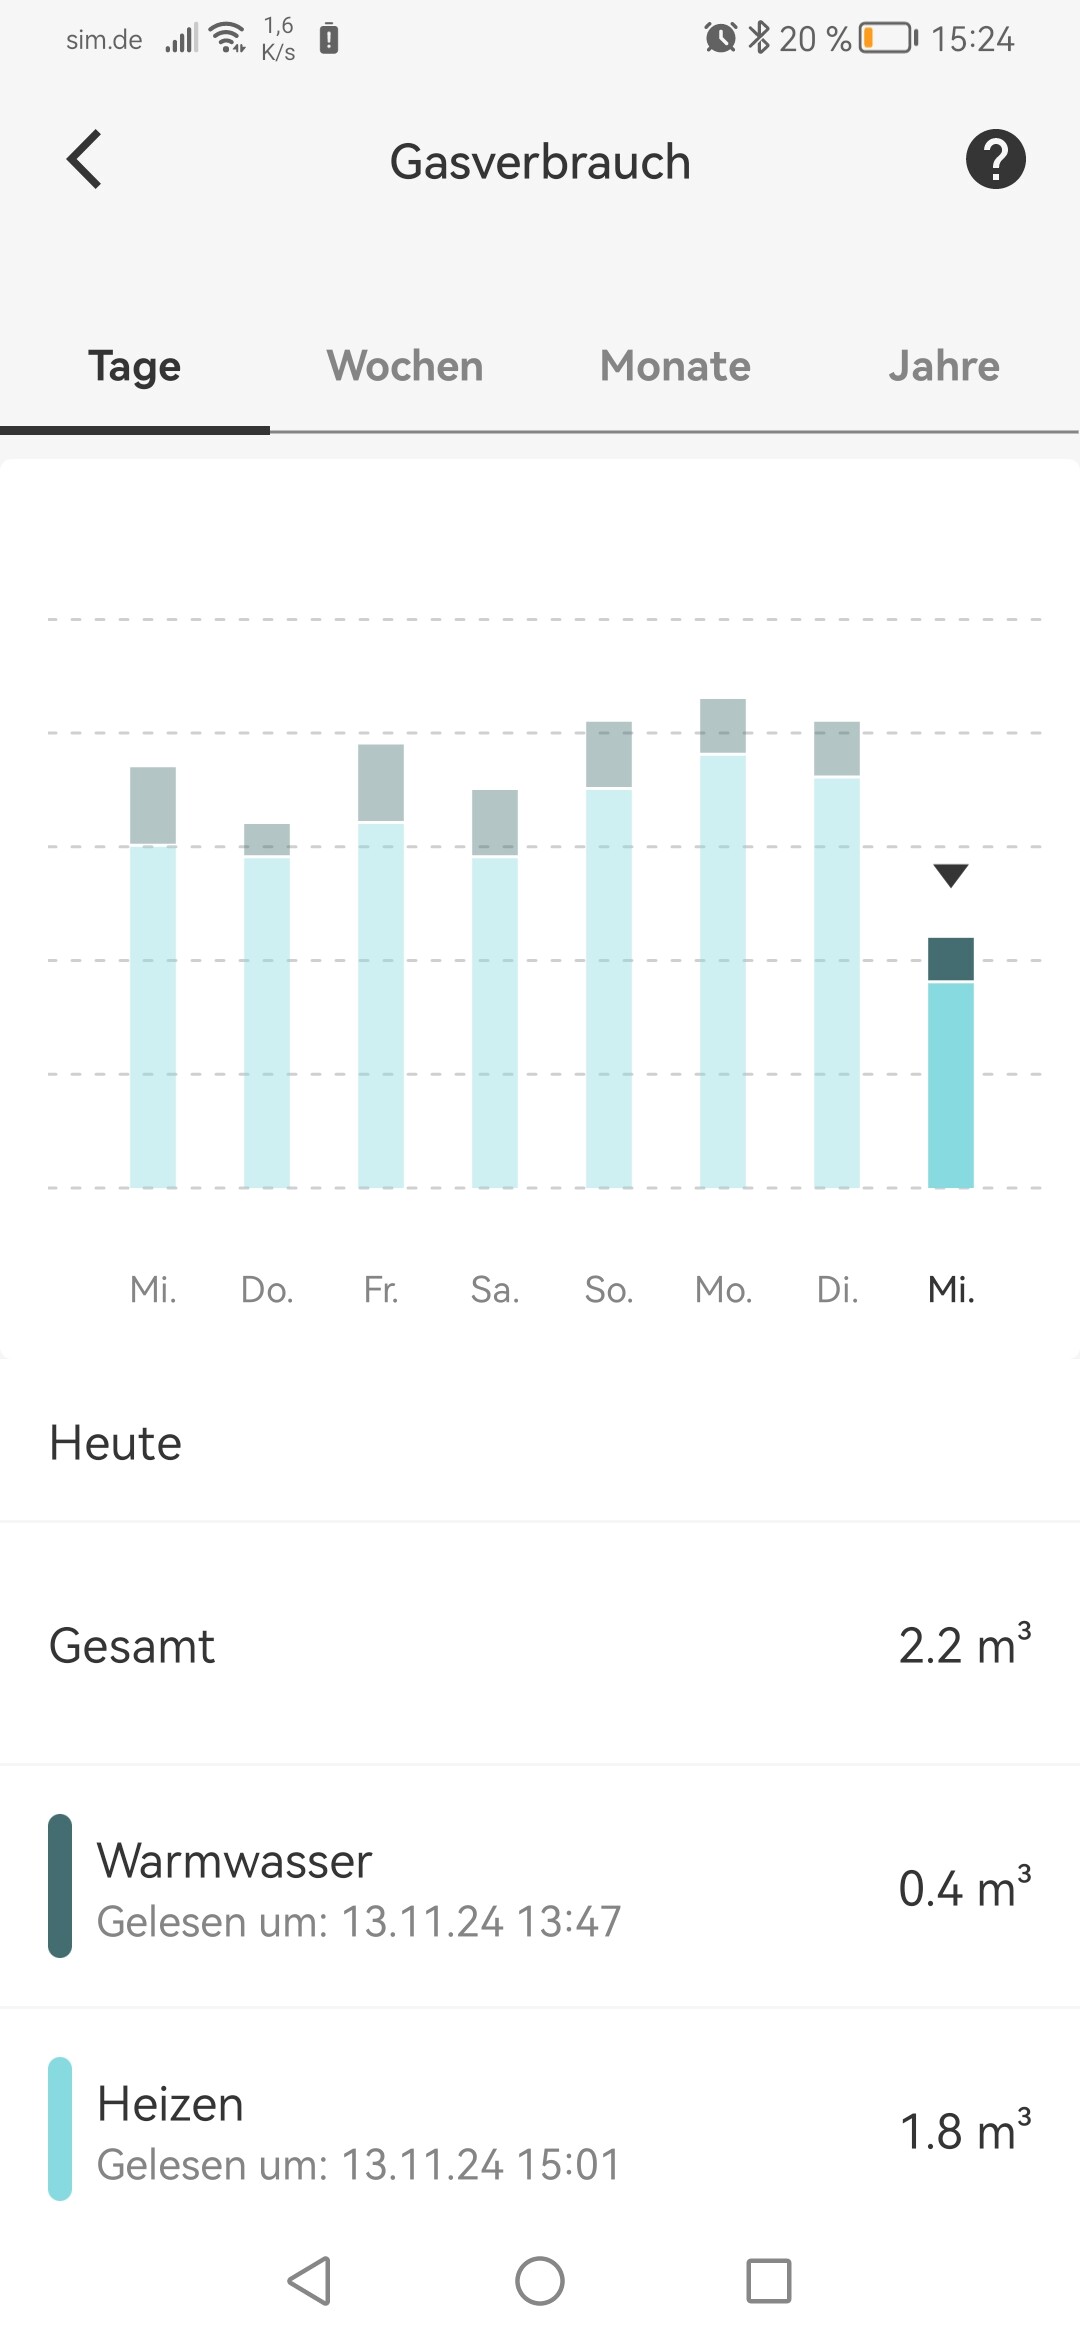
If I convert the m³ into kWh, something different comes out.
mathematically, the total isn’t right either.
1.4 + 9.2 = 10.6 (not 18)
Maybe you have different conversions, calorific values, etc. in Belgium…
I don’t know whether someone else has seen this problem. On the desktop version (my.homey.app) the data is not populated. On the mobile version it is.
Edit: What are those duplicates on the mobile version like: Room, Day, Comfort, Night, Hot Water? The first figures are not rounded, while the duplicates are.
2nd Edit: I guess the duplicates are the “Set” values? But it is confusing that they have the exactly same name as the “Measured” values.
Hello Kenny,
sorry, maybe I misunderstood it or didn’t read it correctly.
It looks like the gas-kWh are added up daily. (?)
I thought these were daily values.
I think one of both is the defined target temperature, and the other one the measure temperature. I will have to dig into that to ensure that we only have the measured temperature.
They should be summed up yes, because the definition of the capabilities in Homey requires me to have an ever-increasing number here. But I’m not convinced that this is practical yet… I want a better way to visualise the energy, preferably tightly integrated into the Homey platform.