Hi - I love the app and have been using it from my start of Homey (switched from years of HA usage).
Recently I setup an automated EnergyLogger flow to a google sheet. I automatically log energy usage every hour. When adding up all hours of the day, I get a different result than a full day total. The full day total lines up with my P1 HomeWizard reading. From this I deduce that there is something wrong (or I am doing something wrong) with the hour results. Can you share your insights?
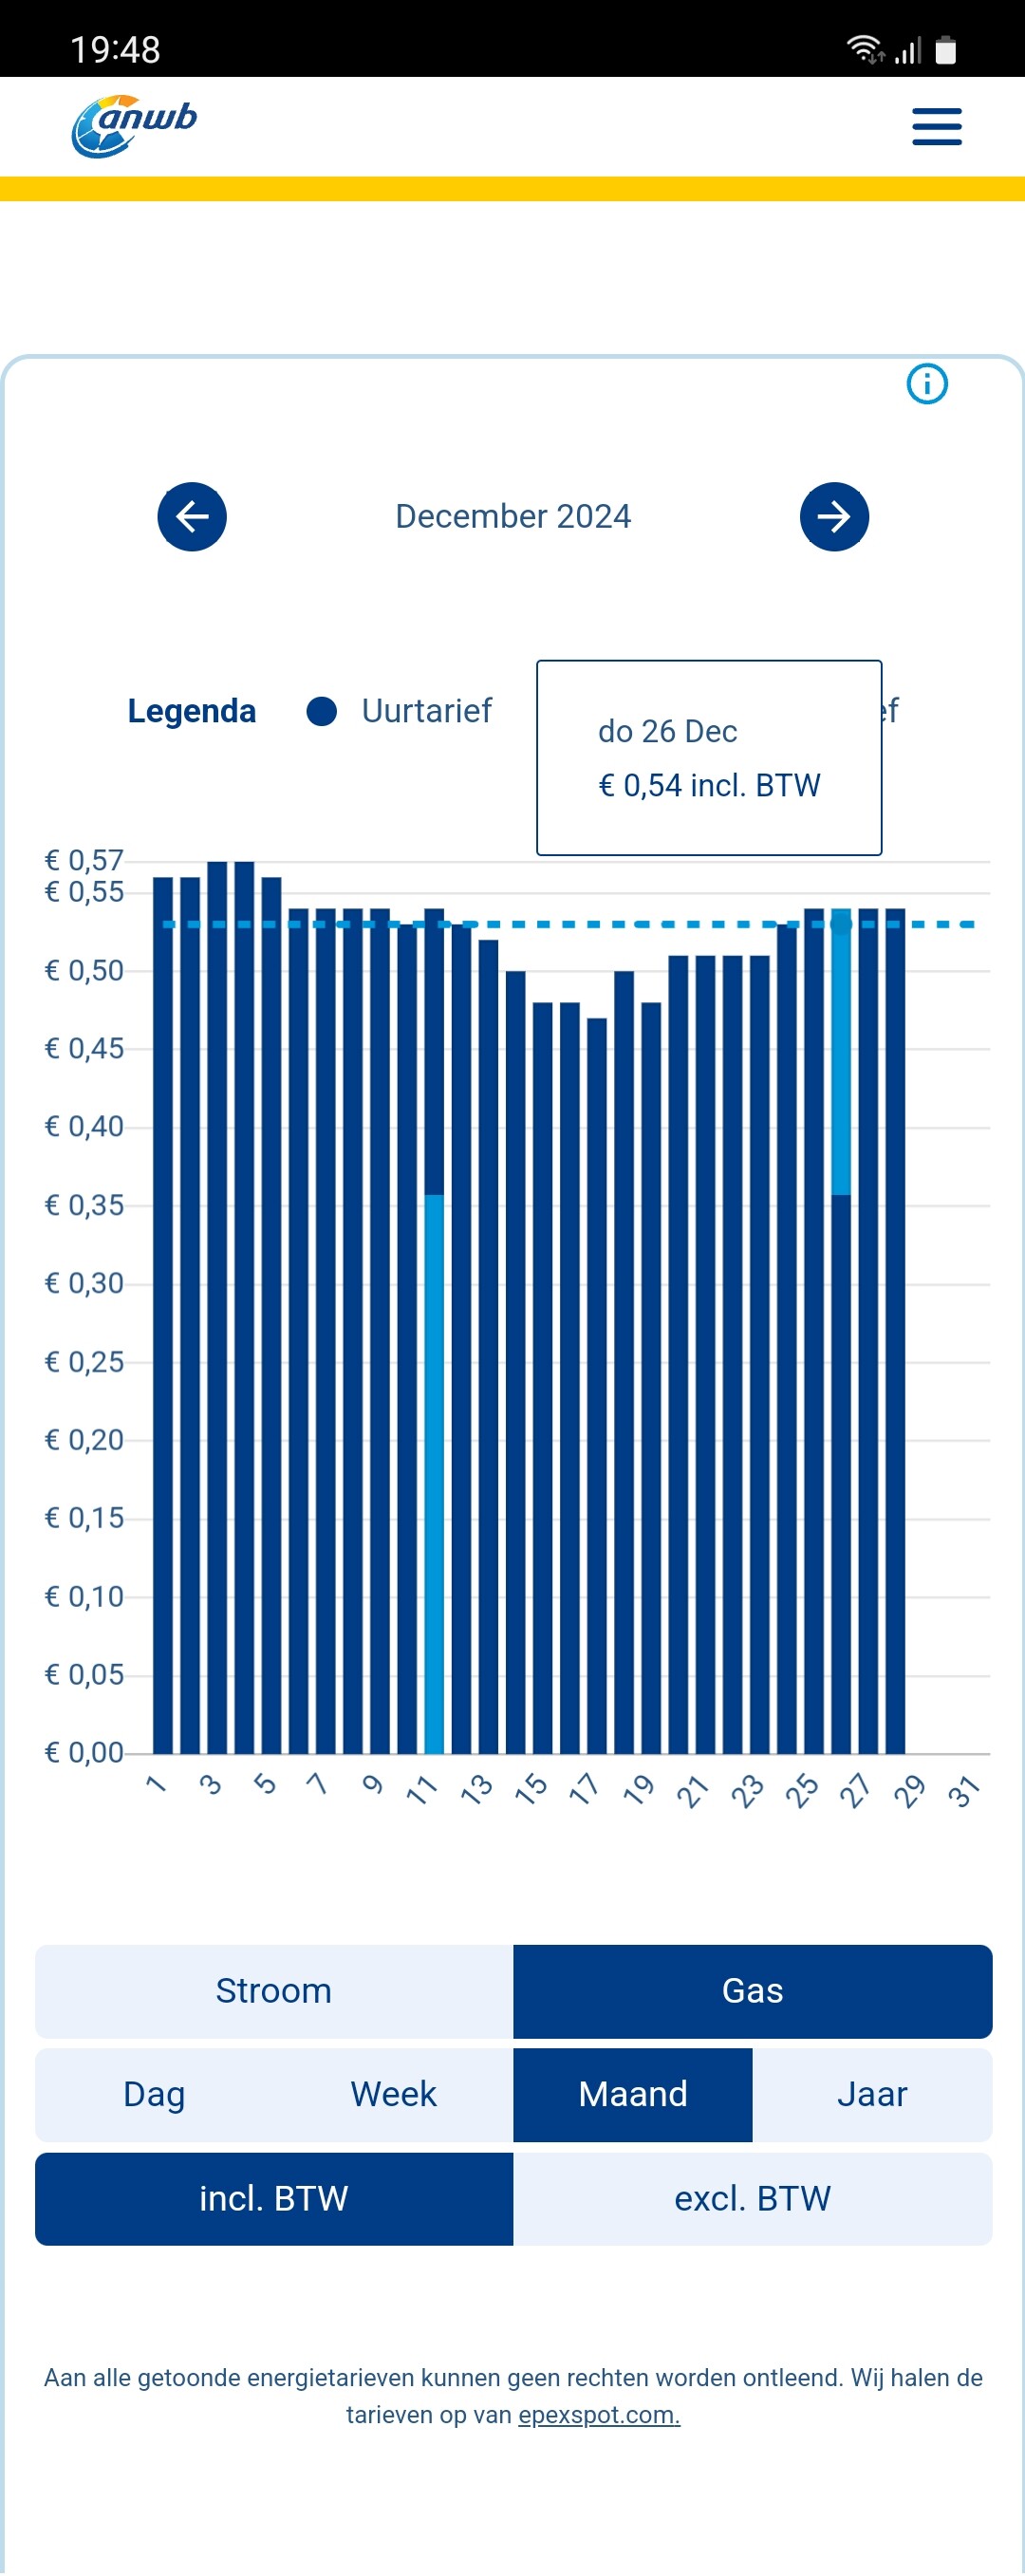
E.g. for gas:
m3 deze dag: 8.56
sum of m3 dit uur: 7.431
P1 reading: 8.560
Hmm… true, I will change that later today. However it wouldn’t explain that the individual sum would be higher. If the hour is still running then I would expect the total to be (slightly) lower
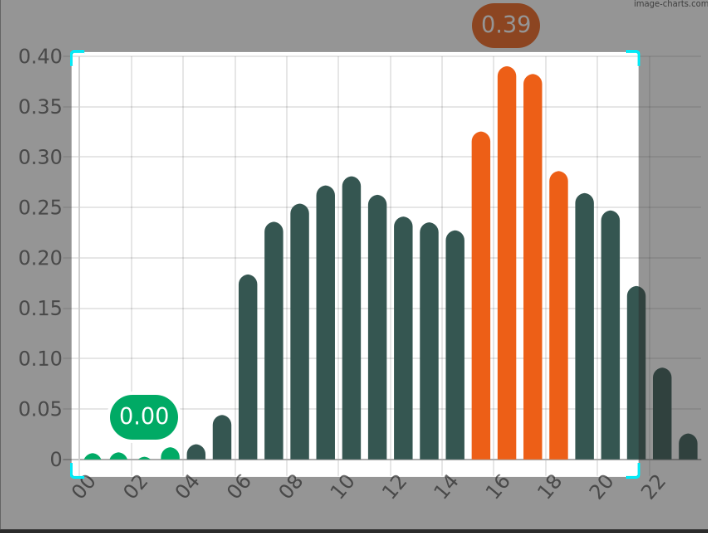
For whoever is interested, I’ve created a short tutorial on how to display the current energy price using the Power by the Hour app and DataVista. If you’re curious about visualizing hourly energy prices with a gauge, check it out here:
Do not overwrite the label, unless you prefer to display a fixed value instead of the actual price.
In case I want to use the Better Logic currency formatter (good hint!), it’s output tag can’t be used as [value], because it returns a string tag.
So I use it as [label], and the original numeric price tag as [value].
It updates every hour @ price change w/o problem:
New to PBTH and have a few questions. I am in Australia and my energy provider sells at wholesale prices. They also have a Buy Price and a Sell Price, both of which can be -ve or +ve.
Trying to understand Update Group. From what I read you just enter 1,2,3 etc and track manually what you want to use each group for, although I’m sure I could parameterise them.
So is it valid that to track the buy and sell prices I can enter 1 for the Sell price update group and 2 for the buy price?
Also is there any issue with these values being -ve?
Thanks for pointing that out @Peter_Kawa! I’ll update the tutorial and maybe update the DataVista app. To not clutter this thread, lets use the DataVista topic for further discussion.
Hi,
very nice APP, I already found many nice cards to use, but is there a possibility to get the price in Swedish öre instead of SEK? (100 öre = 1 SEK). The prices are often low, so low that the resolution in SEK is not showing the actual price.
Is it all so posible to make one tag more to use
Price -1hour
so you can use it on export data to a sheet (google) on every hour (at electricty) and in the first hour off the day to export your gas price . And yes we have all ready Use last hour and price last hour.
Ok i can calculate back in the sheet, but if avaible i can export direct.
Now I have a flow with a variable for the price (Electricty/gas) last hour/day
every 5 min after the hour (for Electricty)
Copy the info to a new row in the sheet #date;#Time;#Price-E-1U (the variable);#money lasthour
Then I copy the #price now to the variable #price-E-1U
It do’s the same but it some extra task/work
there all all ready a lot off tags for ever + houre in Electicity and gas so maybe one more for the latest hour -1 could be one more.