I was really pleased when I got the email stating that Insights now is available on mobile devices! This is one of the features I have been missing the most as an avid Homey fanboy.
However I have two suggestions:
1: Make it possible to chose the span of the X-axis.
The one sensor I follow the most is my Aqara’s barometer. When I check the pressure history for the last 24 h in the mobile Insights this is what I see:
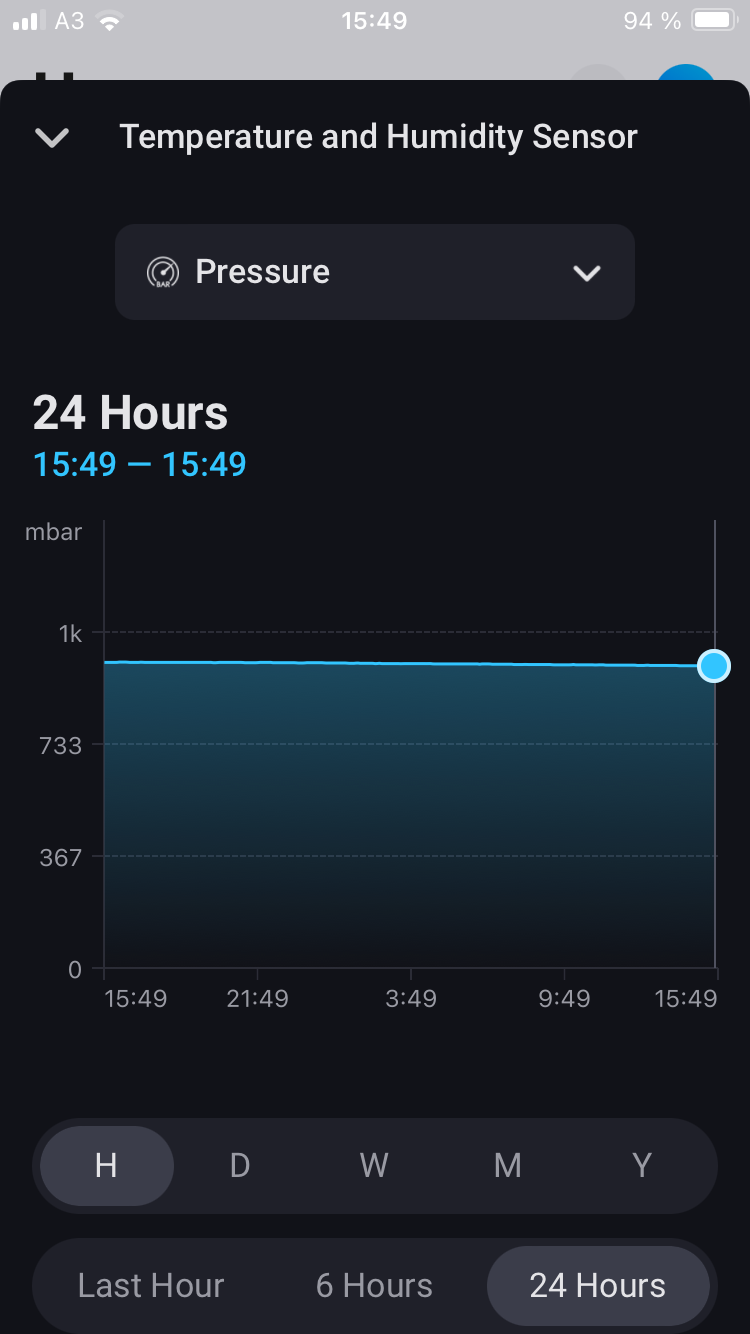
Not much information in that graph. When I check the same period in the web gui I see this during the same time period:
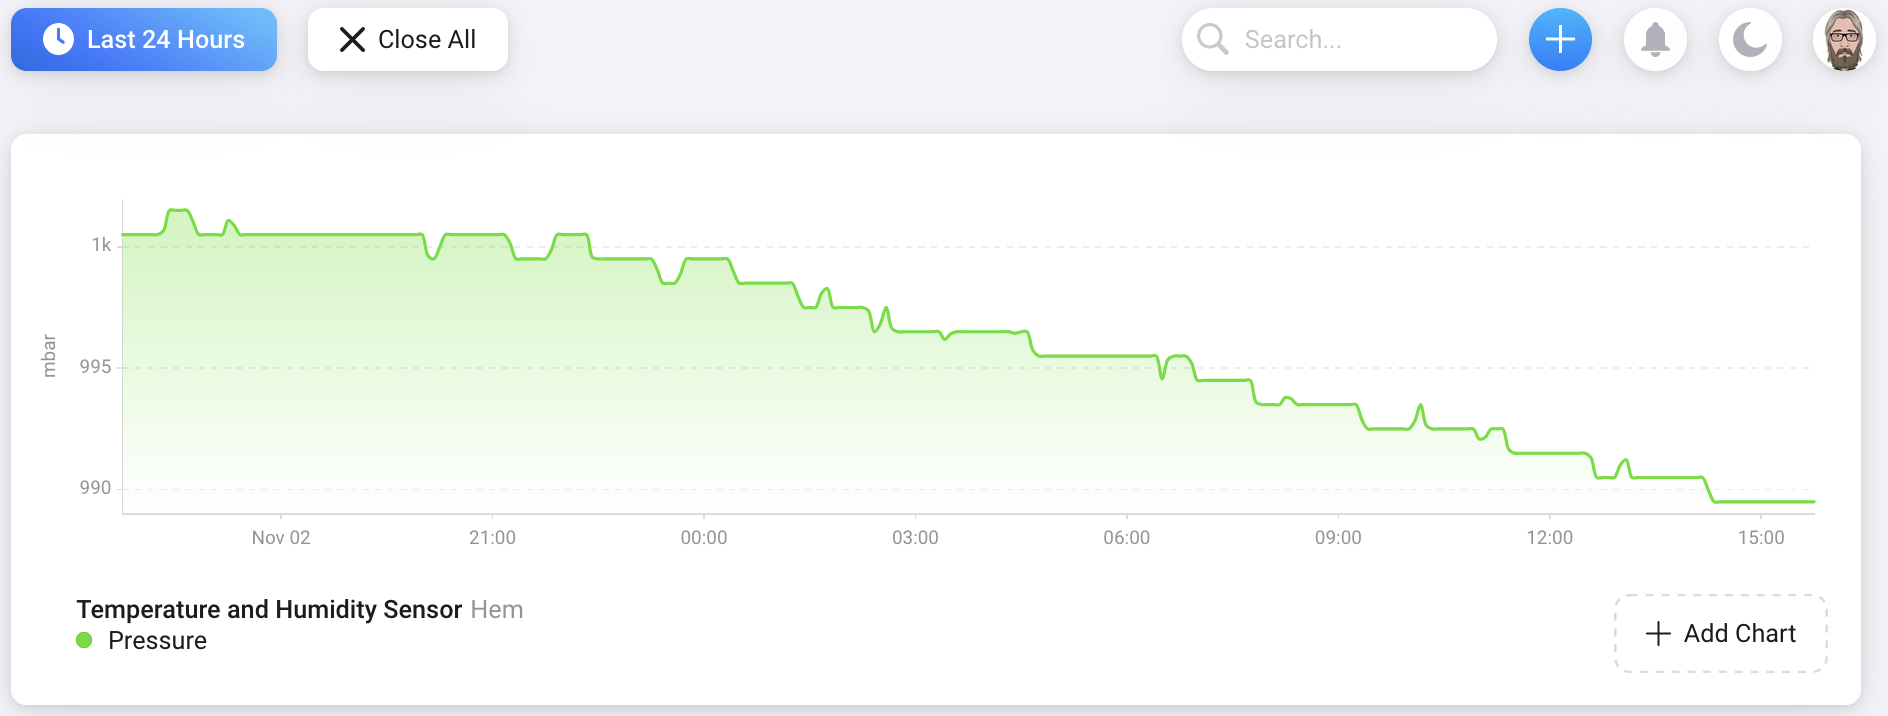
A bit more clear.
The main difference is because the X-axis in the mobile app start at 0 and goes to something over 1000 bar and in the web gui it start at 990 bar. The barometric pressure normally varies between 940 bar to 1040 bar so there is absolutely no reason for the X-axis to start at 0 for a barometric pressure sensor. If the barometric pressure ever goes to zero all life on earth would be dead since long. For the second reason see suggestion 2.
It seems that all graphs start at 0 on the X-axis. Even energy metering devices have 0 for kwh which means that the graph will always be a horizontal line except for a short moment after you reset the power consumption for the device. I also wonder how the temperature sensor graph will handle values under 0° C.
2. Enable landscape mode for the app.
This has bugged me since the first time I tested the app and for mobile Insights it’s really bad that you can’t get the wide view of the graphs by turning the device on it’s side.
With that said, I’m really happy that Insights now is in the app, and I’m sure the devs will evolve it in the coming versions. ![]()
