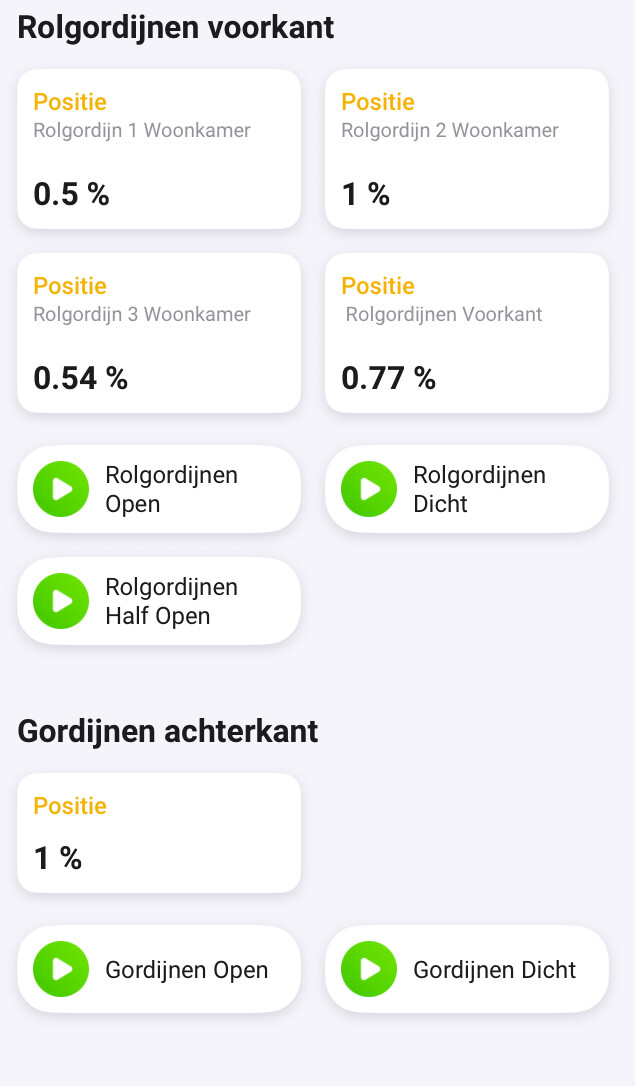
Also IMO the purpose of dashboard is for it to be small and compact and have most used or favs on a single screen. Most of the widgets IMO have too much info and need to be smaller and simpler. Slider widgets should be one line…smaller device name, and then slider, then on/off toggle on on one line. Is there a way to do that or request it from Athom?
Something like this…these are nice simple and clean slider/widget that more useful for a dashboard imo
Hi,
Is it true that we can’t initiate kiosk mode on a guest user? I like the feeling that someone has only read rights. So to give someone access to kiosk mode it needs to be an user instead of guest. Then the users will with most of the cards/widgets be able to access device settings. Do I miss something?
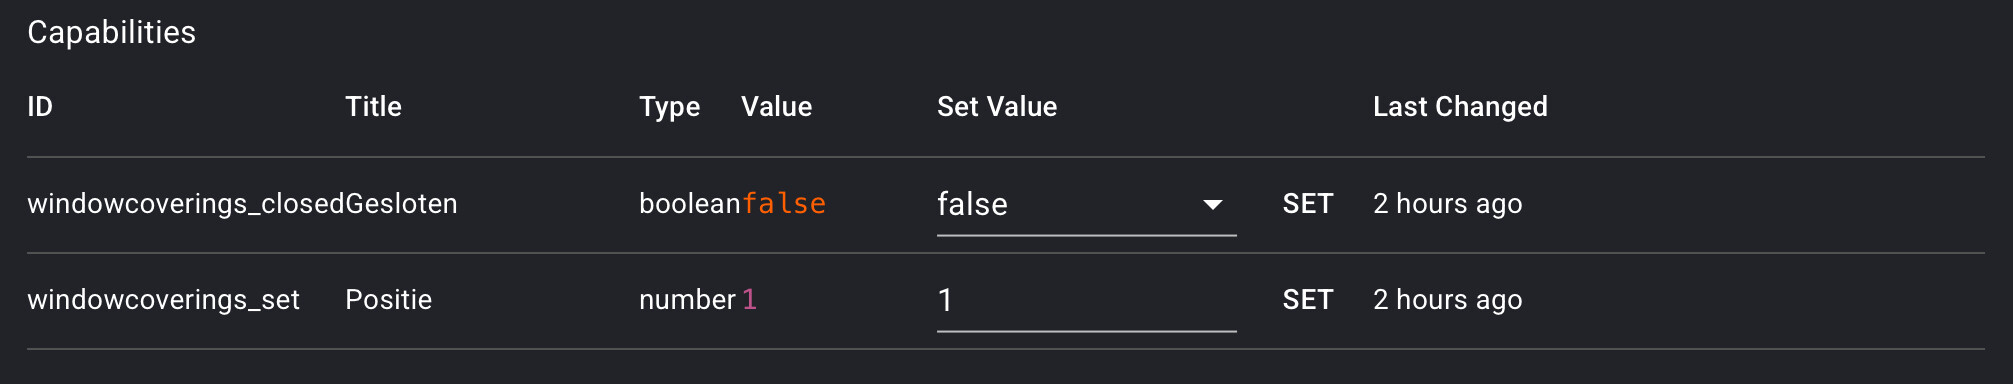
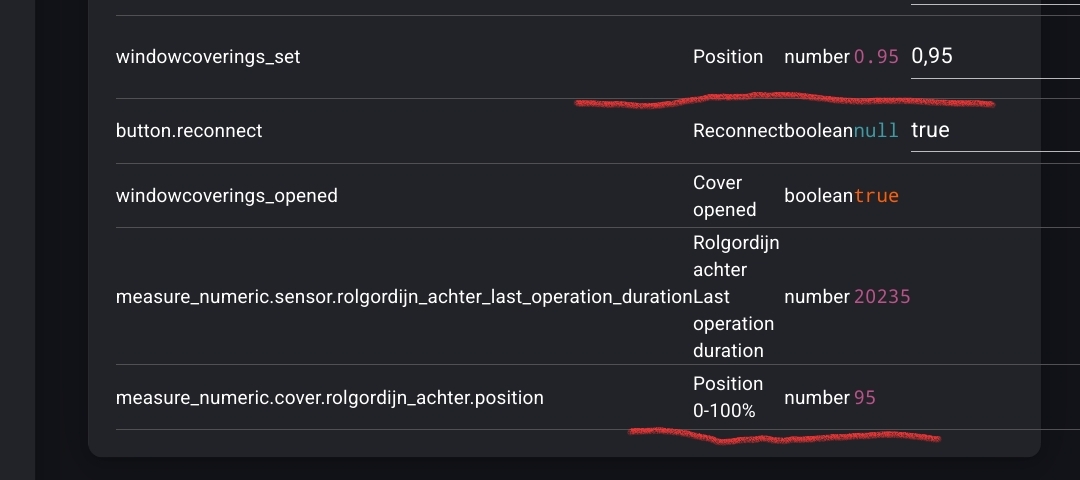
So Athom has to look at it. Perhaps it’s not the unit but the capability itself that is checked to show a percentage (0..100%) for the real capability value (0..1).
The 0..100 is only shown in the GUI.
@bouke Is this something to check for the mobile app? Thanks.
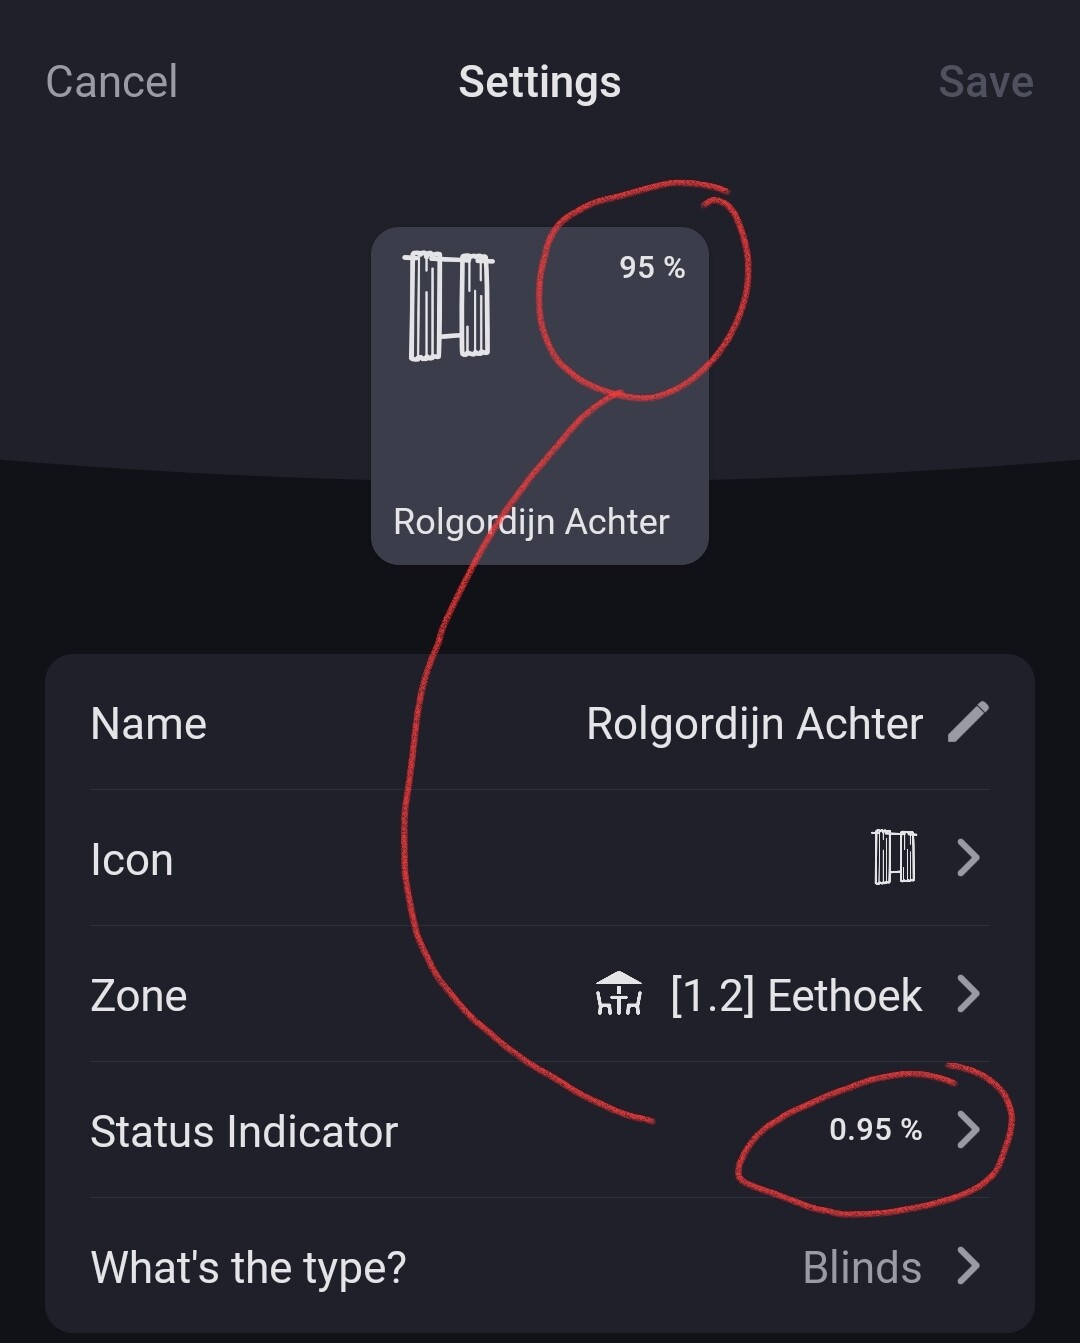
So actually nothing is going wrong, it’s just the way the dashboard widget is designed?
Did you create a separate sensor / variable to correctly display the position ?
Well, when I think of it, because it’s a “sensor” widget, and not a “device” widget, you shouldn’t use a sensor widget to show dim / position values, but a device widget.
But when you do want to use a sensor widget, I guess you’ve to accept the 0-1 range it shows.
Or,
use community widgets like Enhanced Device Widget; it shows 0-1 values as 0-100%:
It’s a H.A curtain position entity, added to Homey with a measure_numeric capability, next to the original windowcoverings_set capability.
The latter automatically converts the original 0-100 values to 0-1 values.
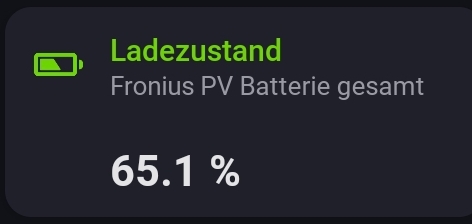
Does anyone know how to get the “Energy” information on the Dashboard? I do see the Energy widget but this does not display the “solar vs energy usage” graph. If this widget does not exist, any tips on how to get the “solar vs energy usage graph” on the dashboard?