Hi, I just transfered from Fibaro Homecenter 2 towards Homey and it works lovely.
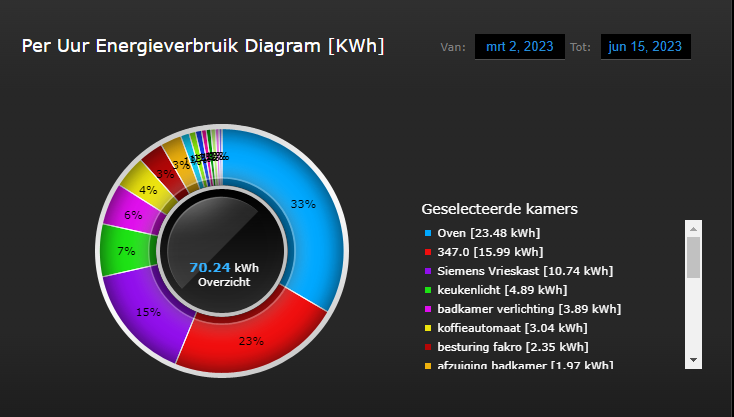
What I really miss in the homey is the energy distribution overview. In Fibaro you can select a time zone and a group (based on rooms or self select) and you can see in a Pie chart the distibution of power usage.
This is very handy to spot drainers, of devices which uses a amount of energy during the day.
In my Fibaro journey it helps me with reducing power usage by smart turning these devices off and even replace old devices with new ones.
However that shows only the energy right now. Insights does collect the historical data and can show per device graf for the history.
A pie chart for the selected zone and time frame would be nice addition.
Maybe the energy page in the web app will have something like it in the future.
Unfortunately, there is no such thing with Homey.
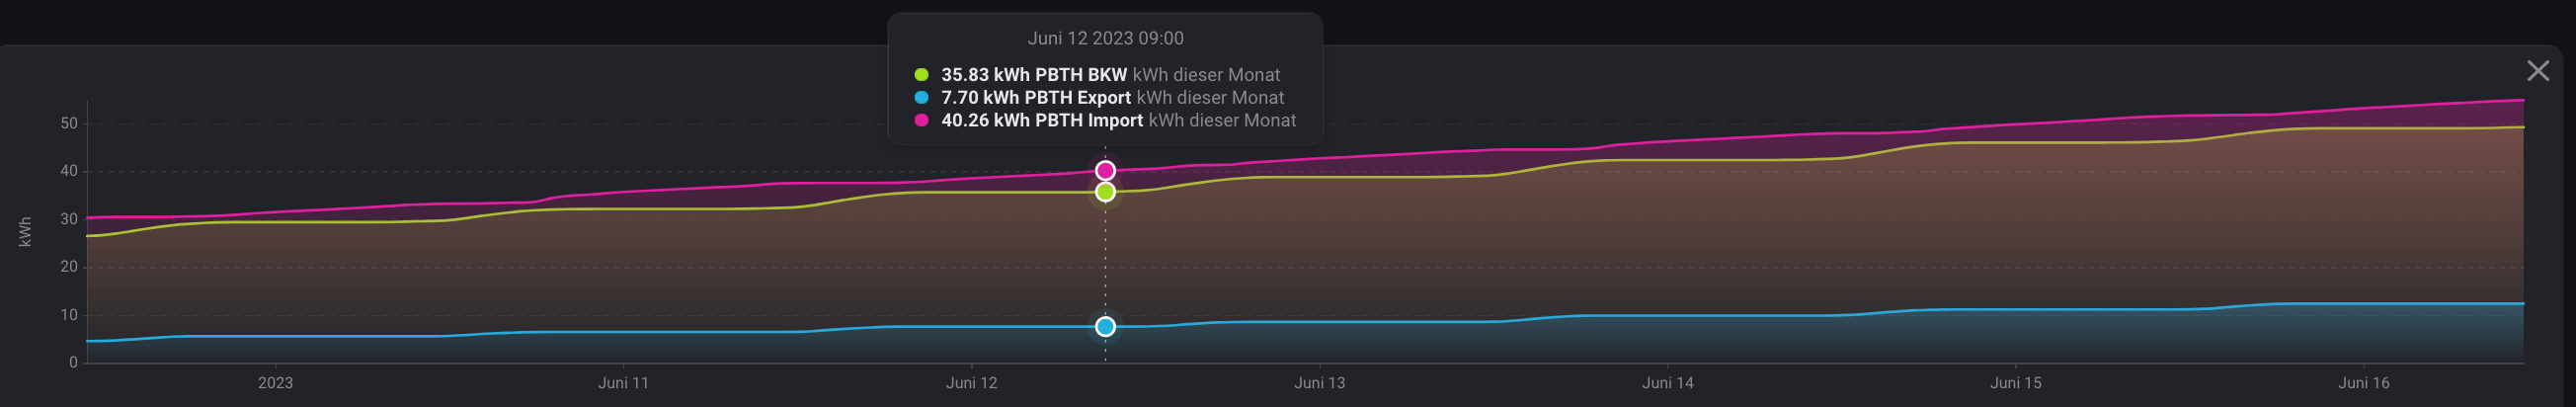
However, there is an app called Power of the Hour with which you can record the consumption of the devices, among other things. The power consumptions created in the app can then be compared in Insights, for example.
And with the Device Capabilities app you can create your own Advanced Virtual Device With the app ABZ you can create your own AVD and create a consumption overview of different devices in it. The data you can use for this comes from the PbtH app.
Sorry, no example available…