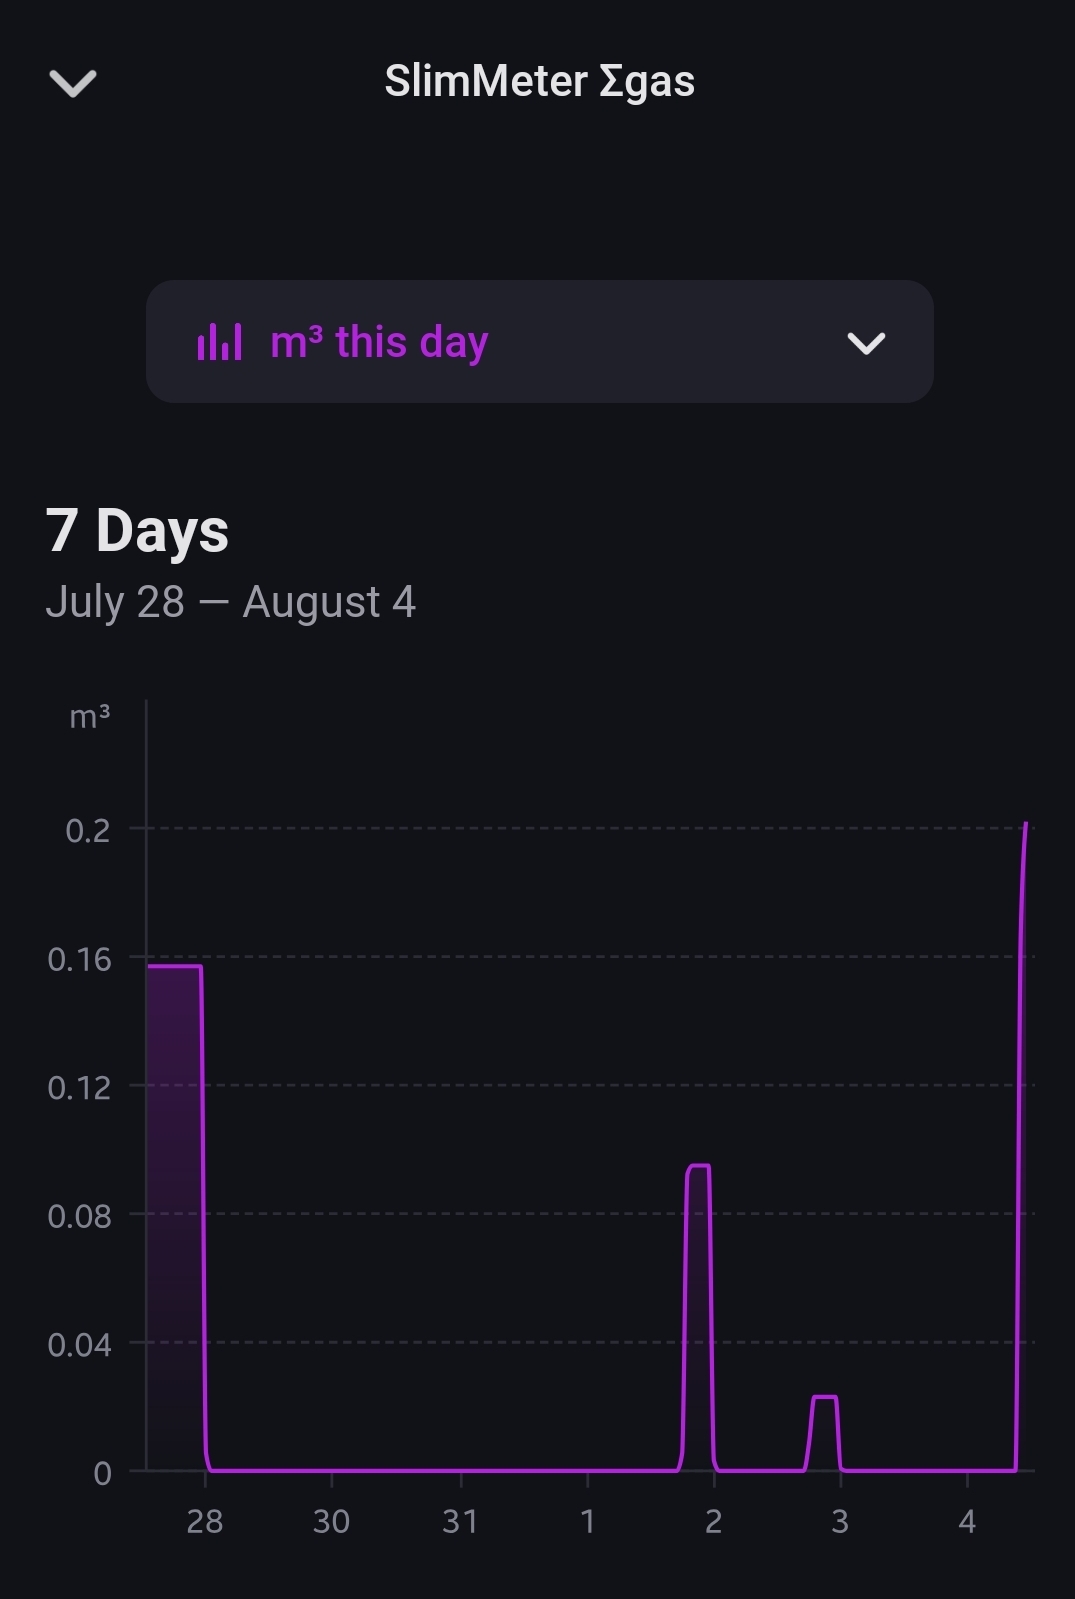
Hi, is anybody aware of a possible calculation error of the “Geld deze dag” values (Gas and Power) in the Power by the Hour app in combination with the Homey Energy Dongle?
Sometimes (see 1 Aug) the app shows high costs, despite a low rate and low consumption.
I did not find such an anomaly in my case. Did you perhaps change something in the PbtH app on Aug 1st that could cause a recalculation / such a spike?
I was hoping i could ask you for some advice; I have a Deye home battery system and connected it trough the blauhoff app. The connection works.
So i created a virtual pbth device to be able to use the ROI functionality in the flows.
The flows (its now the best time to ….. etc etc” never trigger a yes result, so i was wondering what could be wrong? When i open the graph in the virtual PBTH battery, it does not show any prices as well.. What could be the cause? The PBTH vortual battery is using the correct tarif group.
@Gruijter I know this is very specific for Norwegian users, but here we get financial support for prices above 0,75NOK (~0,06€) eks MVA. If the price is above this, then we only pay 10% of the cost on top. The formula would be:
if SpotPrice > 0,75
then NewPrice=0.75+(SpotPrice-0.75)*0.1
Else
NewPrice=SpotPrice
Would it be possible to add this as an slider that can be turned on and of?
First of all many thanks to @Gruijter for this awesome app!
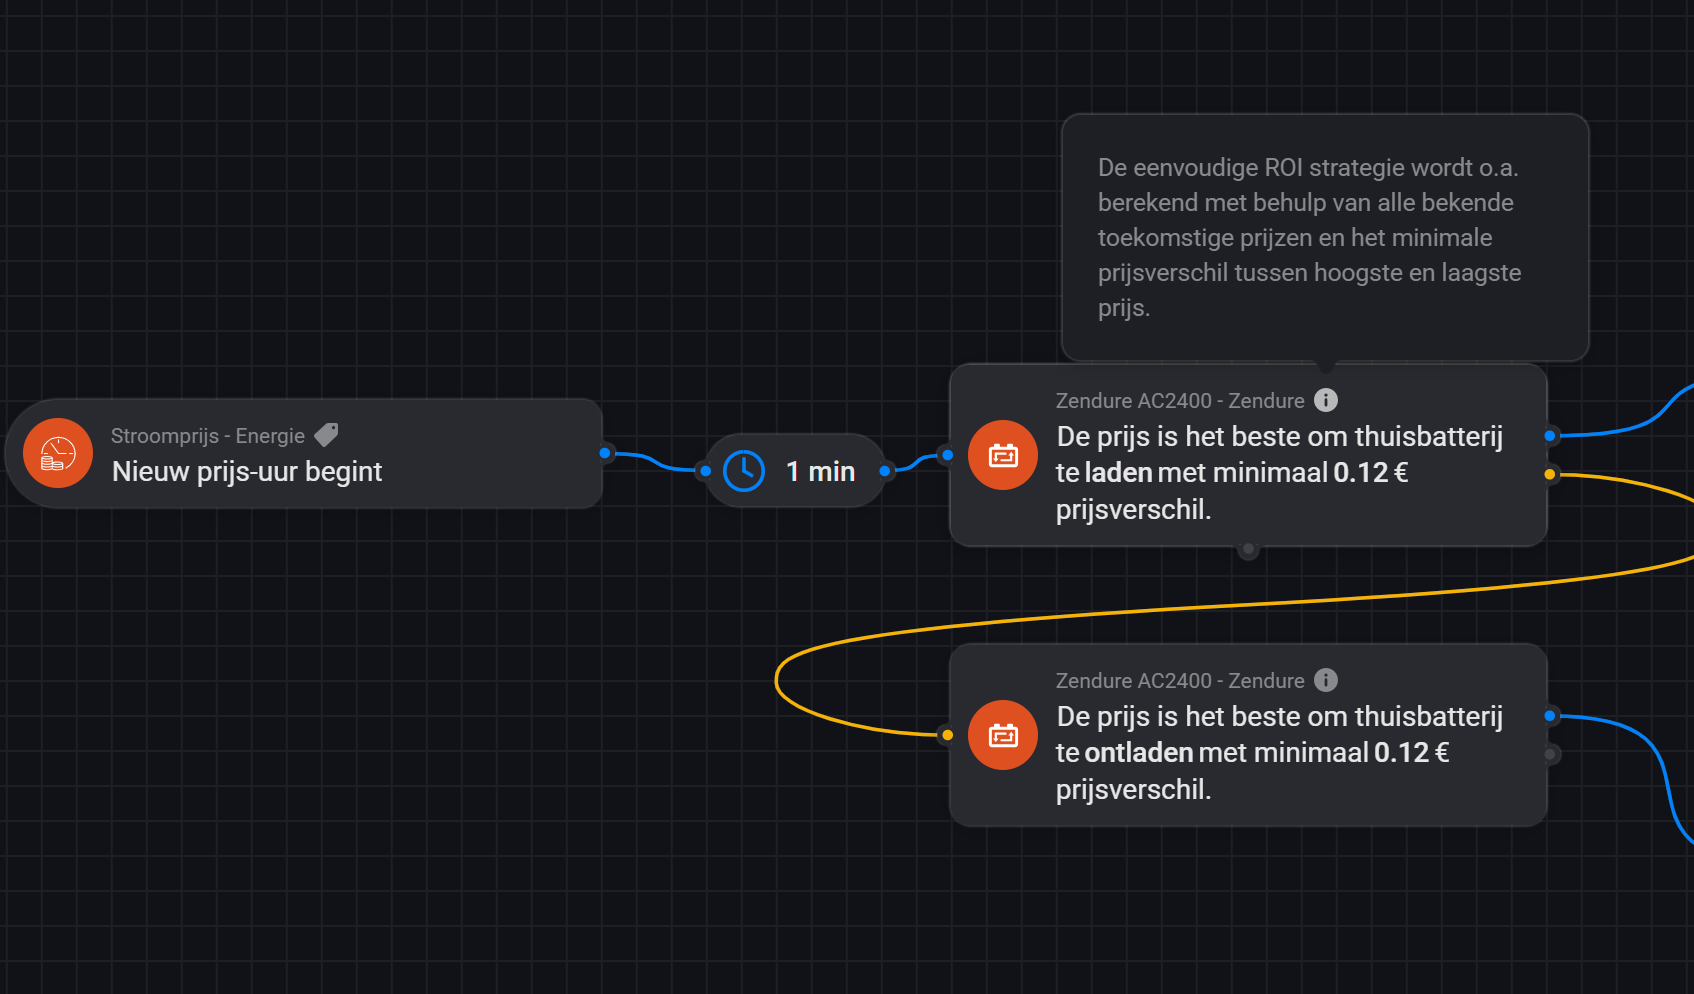
Currently I’m running it on a Homey Pro (Early 2018) and I recently installed a home battery. The ‘Thuisbatterij Monitor’, doesn’t come with the full functionality on my Homey. However, it does have a simple ROI strategy:
I’m trying to understand this flow card, but at the moment it’s a kind of black box for me. Can someone explain to me how this strategy works? What does it take into account? I’m thinking of:
Known future energy prices (not predicted)
Minimum price difference between lowest and higest prices
Charge/discharge power
Conversion losses
…
Also, is there any way to see the result of this flow card: when is it planning to charge/discharge?
I see some posts with a nice price chart that might reflect the result. However, mine only shows this chart, inside the ‘Electricity Price’ device. It seems to only show the 4 lowest and 4 highest prices of that day and it’s not linked to the ROI strategy. Is that right? Is it possible to link it to the ROI strategy and get more insight in the behavior of this flow card?
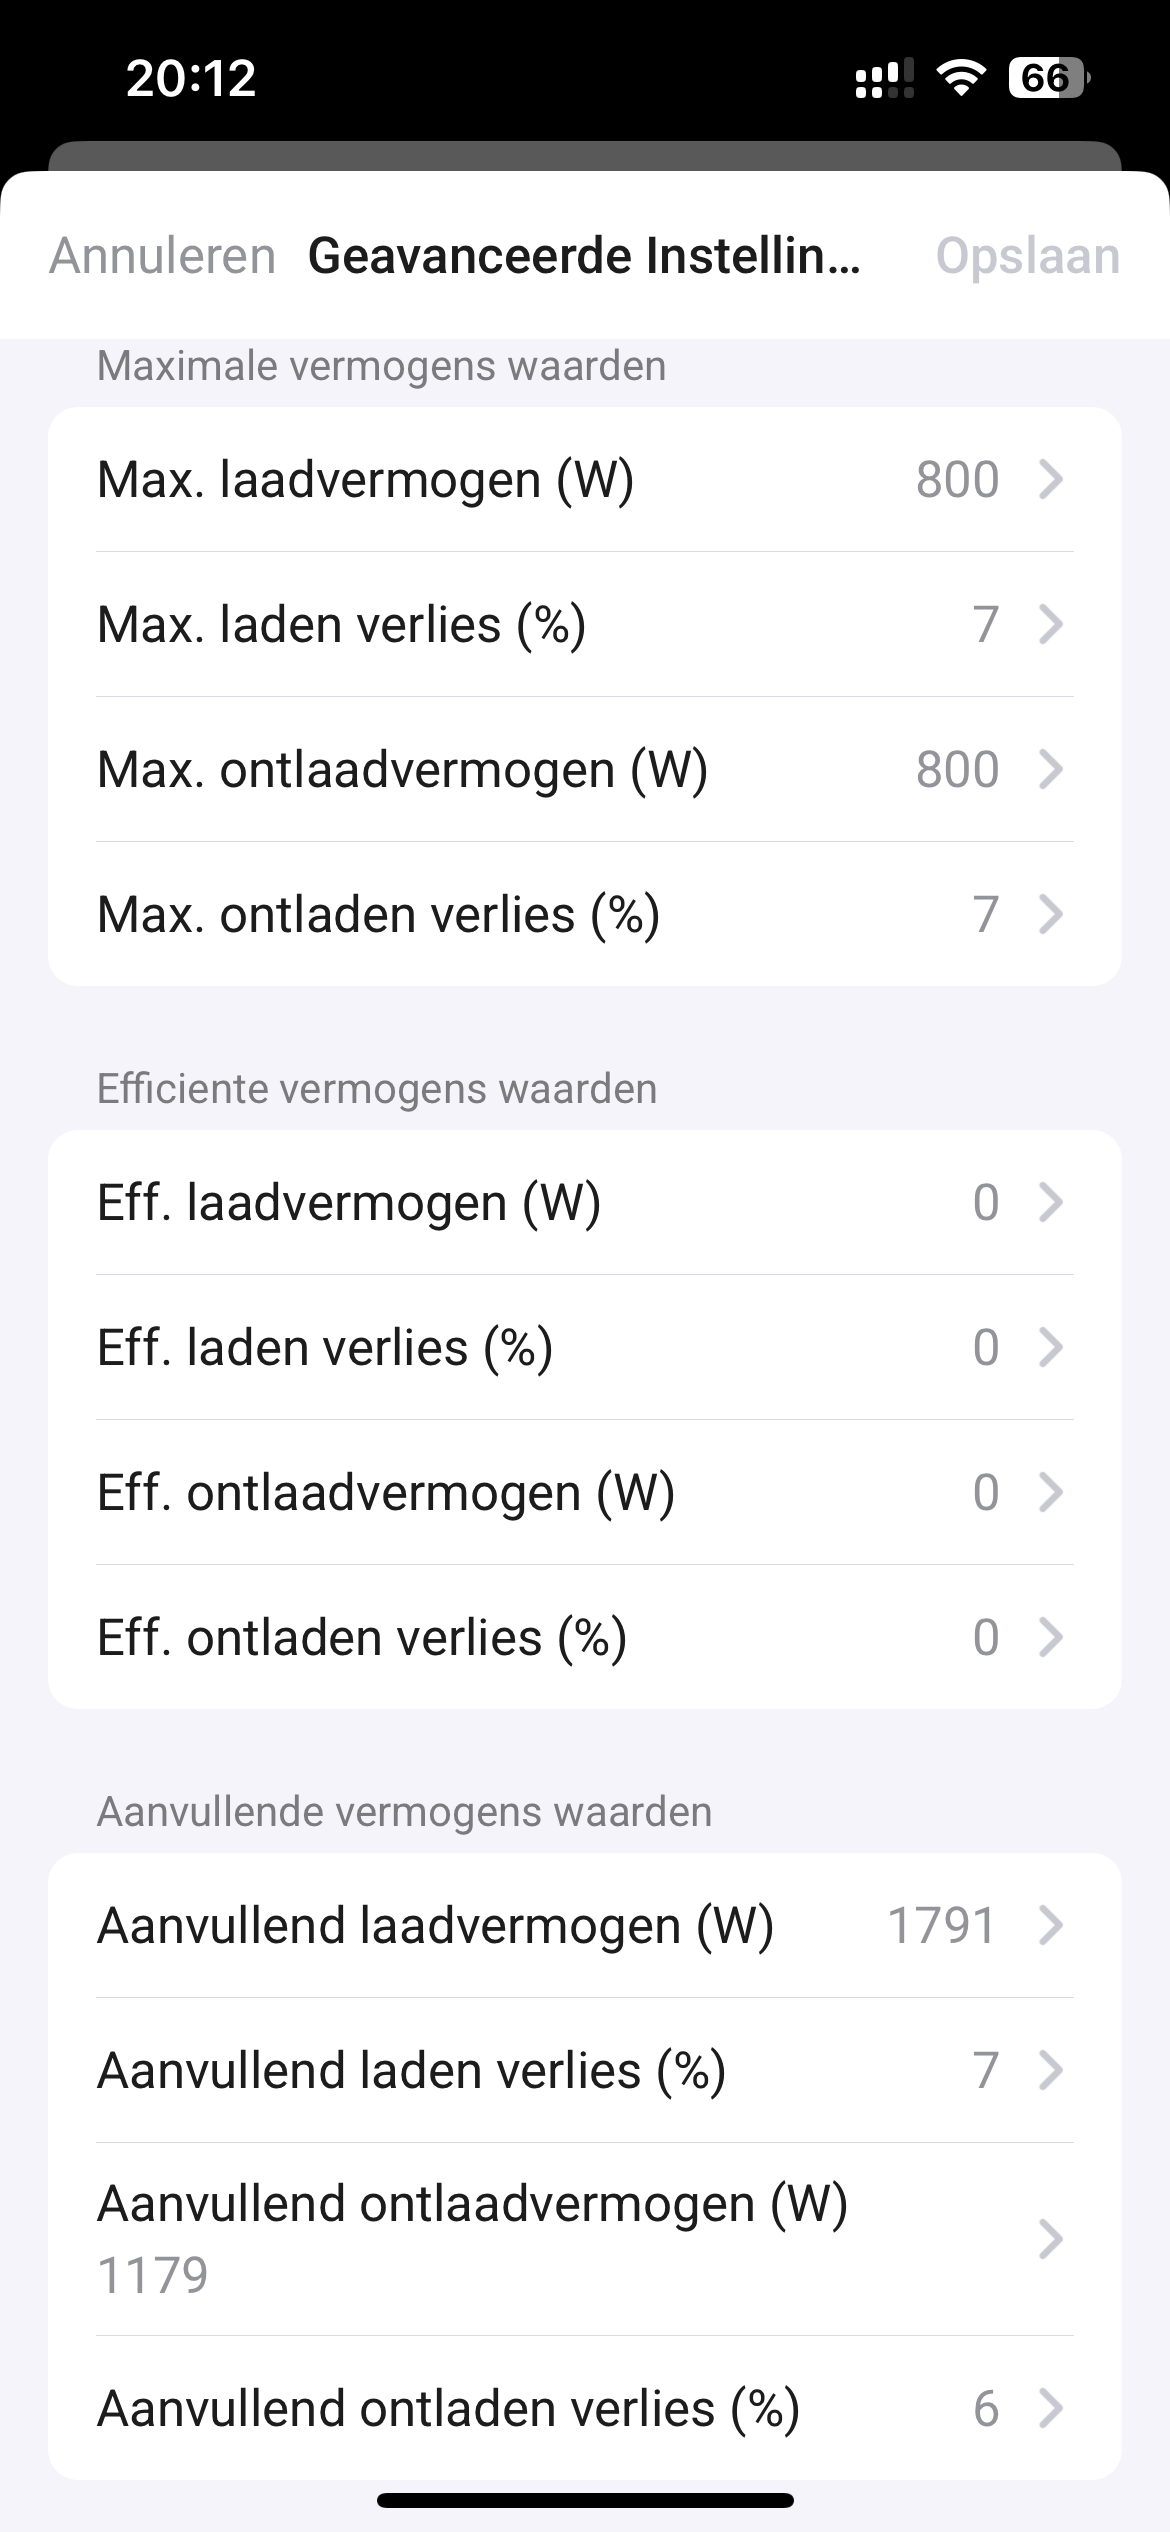
A battery can usually (dis)charge at different rates (watt). Each rate has a different efficiency, caused by losses. Charging at max rate usually has more losses than charging at half speed. You can enter 3 rates. These will be used by the internal algorithm to calculate the optimum profit with the ROI flow cards.
I am a rather new to the game of making nice flows. I have discovered Power by the hour as a very useful app, and have tried to use it to create some flows. I try to start a flow for example when average price in the coming 8 hours period in the 20 hours before a certain time (for example 8 o’clock). But it seems to me that he app does not take midnight into account. It has to be within the same day, it cant cross midnight. I cant find any other topics regarding this, so maybe some can help me?
What i want is to create a condition to find the period of 8 hours with the lowest average price, before a certain time (for example 0800 in the morning) no matter if the period is crossing midnight or not. For example: I plug in the EV-car in the afternoon (between 16 and 20 o’ clock) and it needs 8 hours charging before next morning at 8 o’clock. I need the condition to find the lowest price-period. What is the best way to do this?
Also…when i try to use the “Energy”-flows - they are all using the term “day” when it comes to the lowest price of “the day”. I assume that this means the period until midnight (and not further into the next day). How do i set up a flow that takes this midnight-crossing into account.
And…that the new energy-prices for the next day, are not published until 13’oclock
Thank you so much for the kind and good help. Just to be absolutely sure: Is it so that there are no ways to determine lowest cost period crossing midnight? So the term “today” in all apps and cards in Homey always means the 24 hours before or after midnight, but not crossing midnight time?
And also for example the condition in power by the hour, shown above where it is possible to set both period and time up to 24 hours / o’clock. I thought that the condition shown above will detect the lowest 8 hours period in the 20 hours before 8 o’clock (in the morning, since input value is possible up to 24, i assumed that choosing 8 o’clock means 8 am/ in the morning). What i realise, when i tested the condition yesterday afternoon, was that the condition interpret the 8 o’clock as 8 PM (in the evening), and gave me the 8 hours with lowest price before 8PM, even though prices here were among the highest during the 24 hours.
So just need to know if this “midnight-crossing / spanning” thought is wrong and i whatsoever need to setup conditions for both sides of midnight
You can use the card “price is one of the x lowest in the next y hours”. While you can’t enter a number larger than 24 hours in y, you can create a variable with number 36 and use that in the flow card.
OK, nice to know that this is a possibility. But the limit in this approach is that it depends on when the condition is triggered for the first time. For example plugging in the EV. I always want to have it recharged completely the next morning before 8 o’clock (AM). If the start time of the charge differs, then the period (with a fixed number of hours) will be moved according to this.
Also the app “Heating controller “ provides a card where you can set start / end time of the condition. For example as shown below, spanning from 14:00 (PM) until 08:00 (AM) the next day. The reason for choosing 1400 is that the prices of the next day are known then, and (at least in theory) the condition knows prices until next morning 08:00. But…i am really not sure that this works either….?