For now, edit the widget, enable the “show name” and reopen your dashboard. There’s probably a bug in Homey that has some difficulties handling the small widget.
No, same error for anything I add. I have now deactivate about 8 apps and rebooted Homey, to make sure it is not a lack of memory or performance. The settings now show up for the gauge colors. But still the same error (for all widgets, doesn’t matter) when I add one and try to search for a source.
@Paul_Kessels @Mark1541 Could you both trigger the error and send me a crash report directly after? I have a suspicion what is causing the issue. Hopefully this can be sorted in the next release.
1 Like
Here you are 0754ba18-d6cb-44c5-912d-48fcd7fcb746
1 Like
Did you already read the excellent documentation, as mentioned in post # 1 ?
1 Like
Hi, thanks for the very nice widget! The all look great.
Would it be possible to add an option to make the background of the toggle switch transparent/not transparent ? That would make it a bit more consistent with the other widgets.

Hi @ReneO,
This is on purpose. First it was not transparent. Due to a request to bring two widgets closer to each other @Erikvl87 made it transparent. Correct me if I’m wrong Erik.
But perhaps you can make it selectable.
Rogier
Same here. I followed your tutorial. Started a test flow to create a data range, and now trying to add a widget using this range as data source.
In the DataVista app, the range is shown. In the dashboard while trying to define the data source, this error shows up in a red box
Correct! It was selectable first, but due to the widget downsizing the background wasn’t fitting nicely with the minimal design, so I’ve decided to drop the feature, for now.
I have some ideas to bring the option back, but enabling it may affect the widget height. I’ll reconsider adding this back.
3 Likes
![]() Version 0.7.0 of DataVista is now available in the test channel, with the following changes:
Version 0.7.0 of DataVista is now available in the test channel, with the following changes:
 Hopefully fixed an issue with potential errors when selecting the datasource (@Mark1541, @Heronimus, @Paul_Kessels, can you check and let me know?)
 Improved the inversion of certain SVG icons (@SunBeech)
- A temporary fix is in place for characters being cut off from the capability name (@SunBeech). Athom developers have been applying a border radius that they will try to remove for transparant widgets. For now the widgets are padded slightly on the sides to fix this. This will be reverted as soon as Homey has this fixed.
 Added the option for a 3rd color for the progress bar (@RoyWissenburg). I am still looking into custom offsets (@Torbjorn_Melbye)
- Fixed the initial progress bar animation when opening the dashboard for the value bar rendering from 0 to its initial value instead of starting from 100.
Known issue with loading progres bar widgets:
Homey partially introduced a (undocumented) minimal widget height of 40 pixels, but this restriction was only applied partially. When hiding the name of the progress bar widget, the widget will resize from 45 to 20 pixels which is below what Homey allows for widgets. This is causing a spinner when reopening the dashboard.
Fortunately, I have contacted Athom developers and they will change the minimal allowed height from 40 to 16, so this issue will be fixed later by Homey. For now, please do not turn off the name for the progress bar widget.
The documentation page now mentions this known issue.
4 Likes
Thank you
Tested immodestly bit still the same error
Thanks for testing, I will send you a PM because I’d like to get this fixed asap.
1 Like
I sent you the error log
1 Like
Is it possible to make the trigger switch actionable, maybe as optional? Currently it does not give me any value but a beautiful show of status but it screams “select me”…
Having trouble setting it up, I do not know what I am doing. Can someone share a flow of how to set ut a gauge to show “real time” power usage?
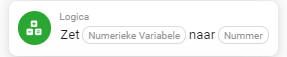
Make a number variable and name it ‘power’

I hope you understand the flow. If the power of my P1 meter has changed → set power to power (logic card)

Select ‘Eenvoudige meter’

Set up the widget:
Databron (data source) = power etc.etc.

Without boiler turned on.

With boiler turned on
Rogier
2 Likes
Hi @Paal_Aamaas, while the idea of making the toggle switch interactable is interesting, it’s currently outside the scope of my app, DataVista. The app is primarily focused on visualizing data rather than enabling interaction. My current priority is to add new widgets for displaying data, and I am currently pretty busy with some new widgets (soon™️).
That said, I’ll definitely take your request into consideration, especially since you’re not the first to suggest it. However, please keep in mind that interactivity is not the app’s primary focus.
1 Like
I should write a tutorial based on this ![]()
![]()
![]()
Thanks ![]() !
!
One small addition: If your P1 device exposes this information, you should be able to select the current power consumption directly as a datasource. This would make using a flow unnecessary.
Honestly…I looked in the datasource for 10 minutes. Could not find it. It frustrated me so much I decide to make my own with a flow.

Now it also shows the unit ( @Anders_Gogstad )
Thanks Erik
You’re welcome! And note that the simple gauge is using an interval to poll for the value (seconds configurable in the widget settings), but if you revert back to flows and use the DataVista range action card instead to set the value and use that together with the advanced gauge, you’re actually pushing each change to the gauge which results in an even more precise gauge.
