another question:
i use fully kiosk to display the dashboard and let the screen go off of nobody is there.
but when the screen wakes up, there is always the message:

this was not the case with the old app. Any hint how to avoid this behaviour?
![]()
I also observe this regularly on my normal desktop … refreshing (F5) always helps, but I also wonder why this is happening … ![]()
![]()
6 hours later
what i didnt manage:
When i played around with the Capacity template the dashboard crashed and could not be recovered. I must create a new one each time.
I know, it annoys the hell out of me also. Problem is that I only experience it on my phone, never on a proper computer with debugging options ![]()
Working on it!
“someone”, no need to say who.. really wanted to have more styling, especially customizable reactive styling of components based on.. basically anything. So with the features I’m working on now, more or less anything could be made reactive and interconnected. Even incorporating data from multiple Homeys in the same dashboards should be easy to implement. Dont even know if that’s something people actually need though ![]()
But, I’m alive and working on stuff! ![]()
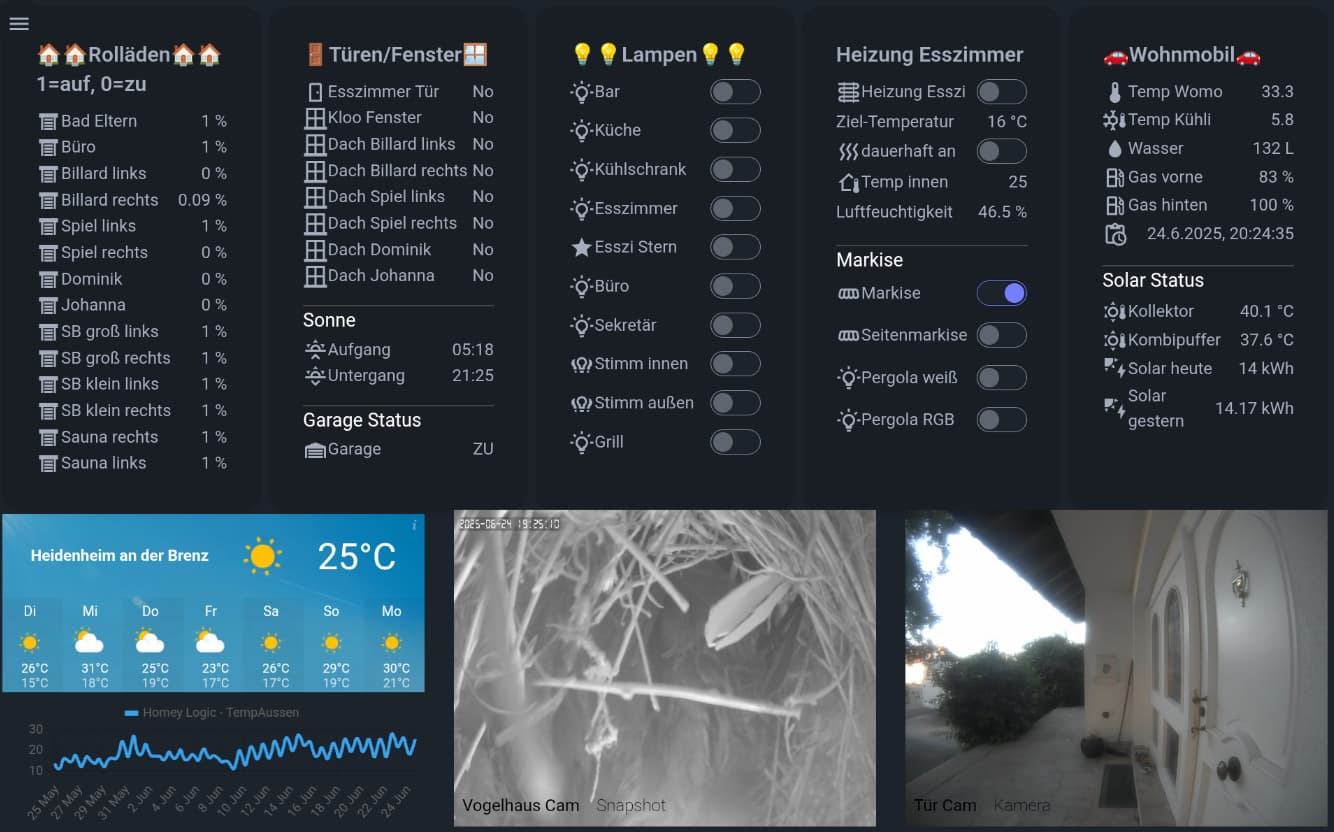
another error is the position of the shutters, in my screenshot the first section left.
the Value of the position of shutters is between 0 and 1 equal to 0 and 100 %.
You display the absolut value as % which leads to between 0 and 1% which makes no sense any more.
maybe you can fix this
Dialogs: a bit tricky:
My approach:
When you then click on “Open” you can edit what shall appear as modal dialog when you open the dialog
before you were able to do charts with two graphs in one and also with cumulated values, so much more options.
the worst thing is to be unable to control shutters, this was very helpful before, but lets see, whats coming up…
wil have a look, puh, UX problem, the symbol is a trash and a name and if you click on the name then you get more options. I was treating it as trash!
thanks
by the way, related thing I observe on Desktop: if I let the browser window open for a longer time … in the background … and later switch back to it:
this automatically disappears a few seconds later after the browser window is in the foreground again… but I would say: no need to issue those errors when in the background maybe …
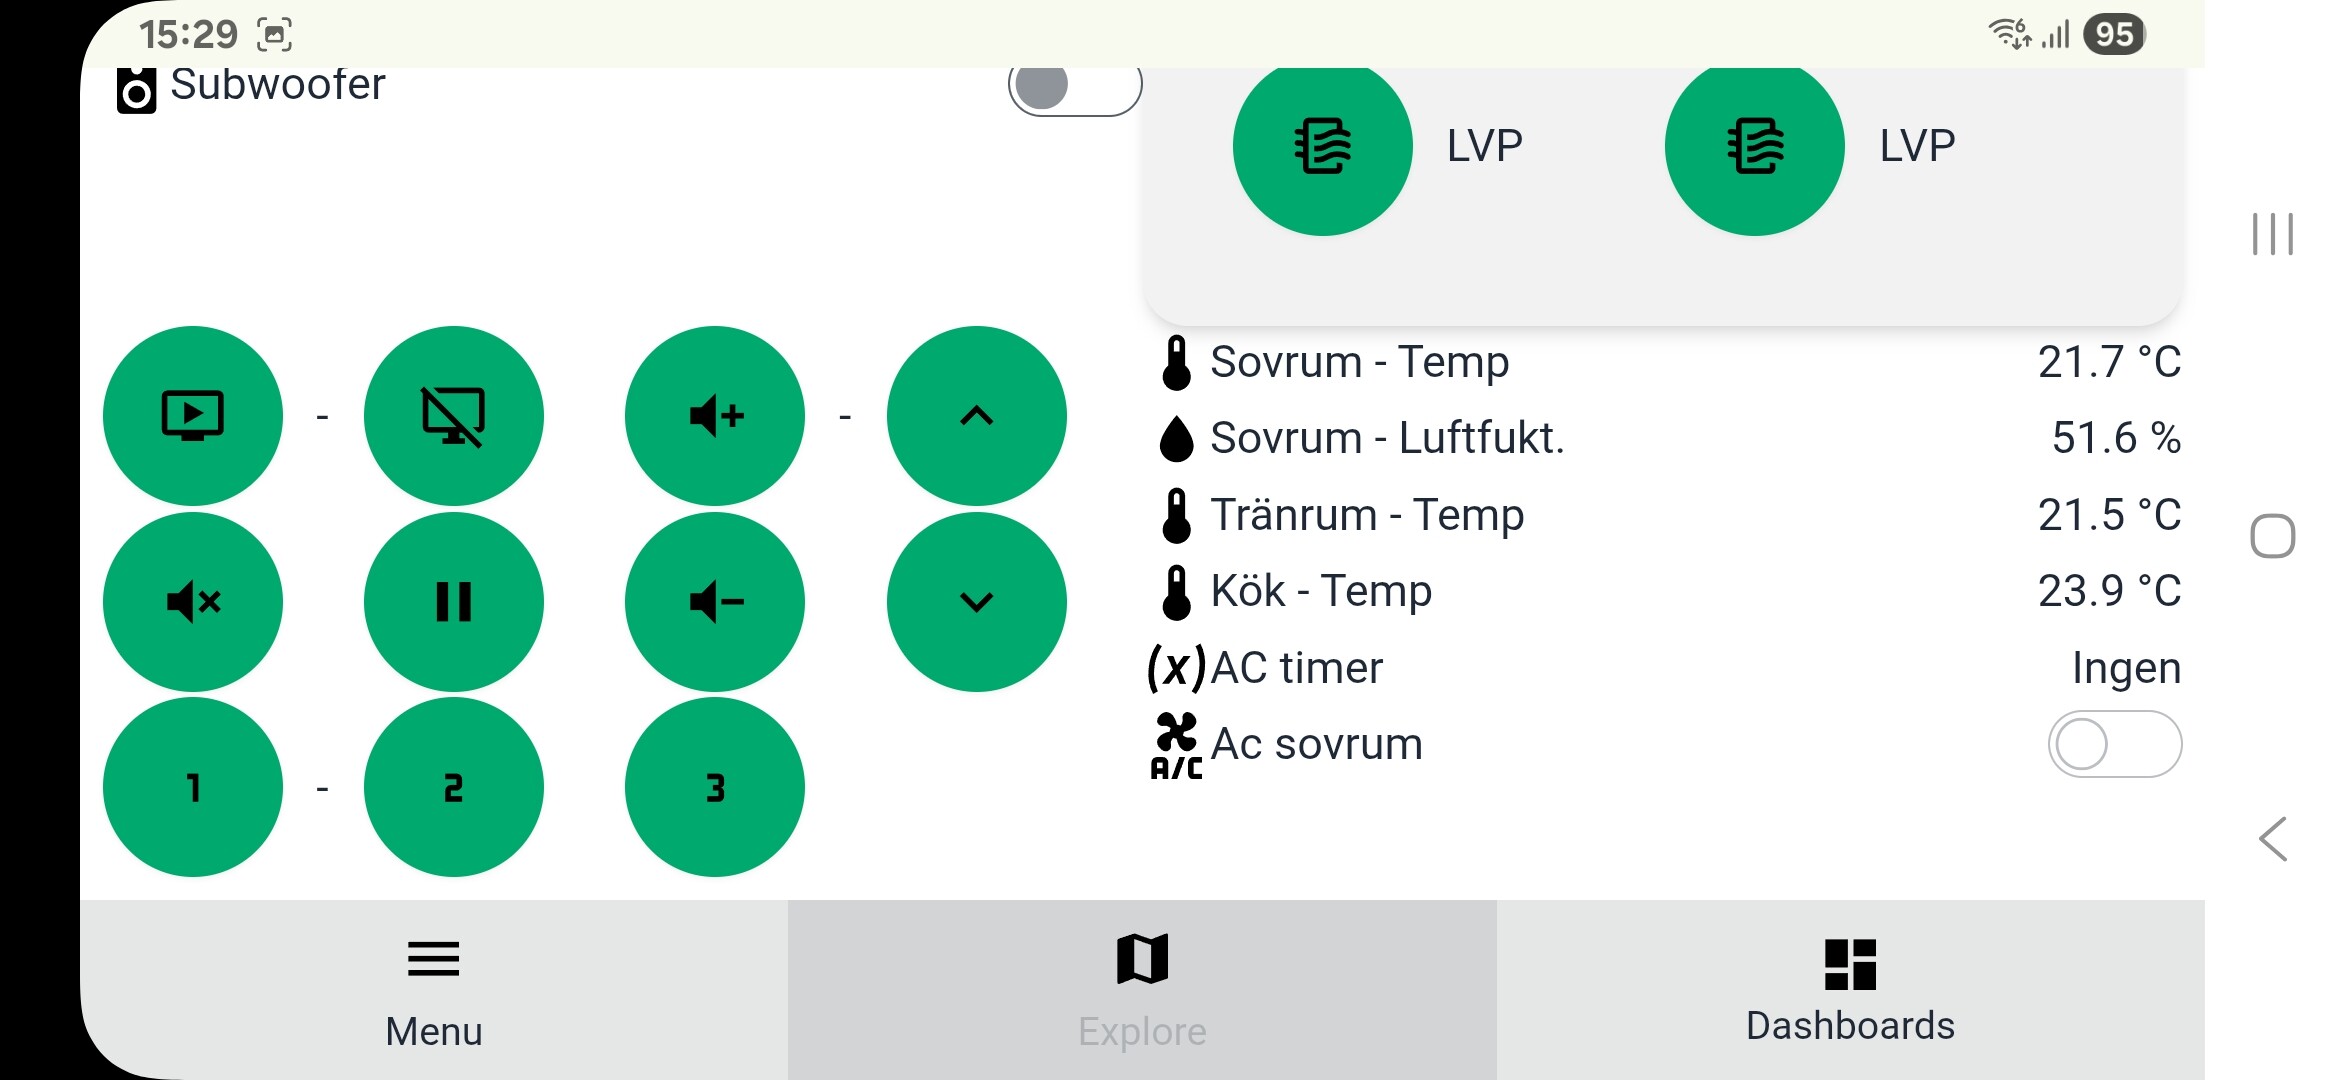
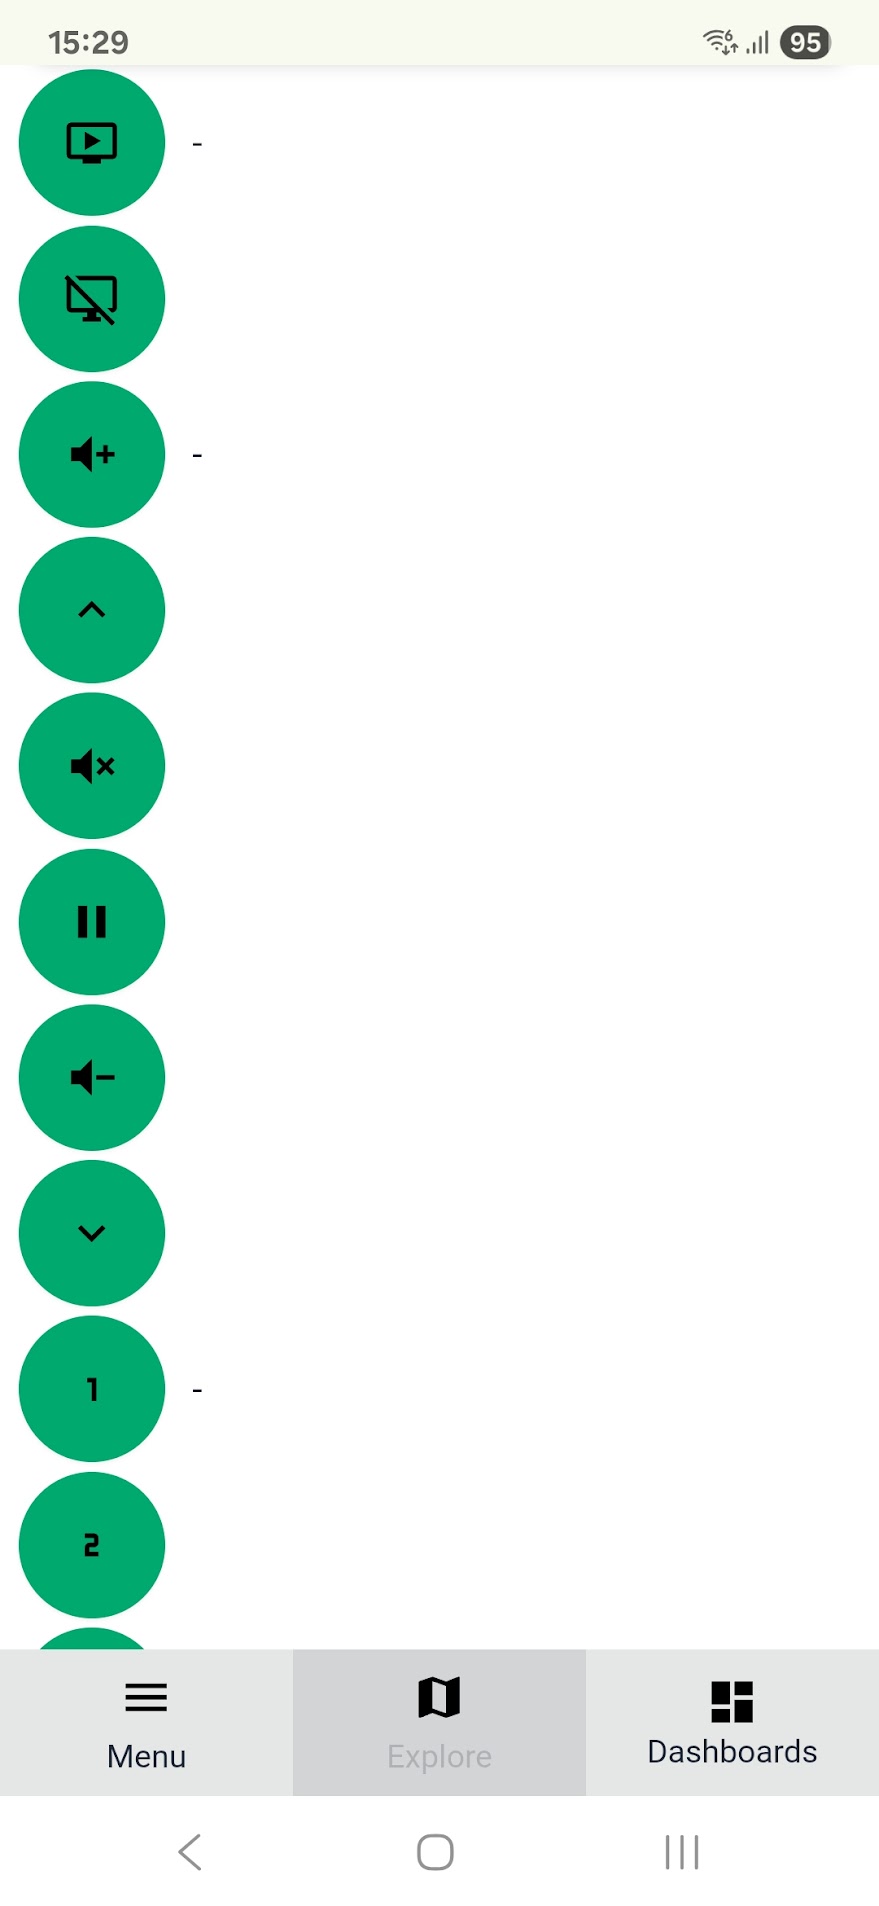
I’m experiencing an issue with the Dashboard app (v1.3) on mobile devices related to how the layout breakpoints handle Section settings width. I want to have 4 sections on my mobile phone in vertical mode, but it ends up with just 1 section (see image below).
Although my Samsung A54 has a physical screen width of 1080 pixels i vertical mode, the Dashboard app seams to use the viewport width (CSS pixels) to determine layout breakpoints. On my device, the viewport width is reported as around 384 pixels due to device pixel ratio scaling.
Because the Dashboard only defines layout breakpoints starting at 640 pixels (small = 640–768 px), any viewport width below 640 pixels defaults to a single-column layout. This means on many mobile devices, the Dashboard always falls into the “under small” category, resulting in only one column being displayed, even though the actual screen is wide enough to show more.
Additionally, the app currently does not allow customizing the layout grid below the 640px breakpoint, which limits flexibility for mobile views.
Suggested improvements:
Allow setting grid columns for viewport widths below 640px
Or consider using device pixel ratio or physical screen width alongside viewport width
I hope it would be possible to improve the Dashboards app to solve this.
Thanks for your hard work on this app.
HORIZONTAL:
VERTICAL
Does someone know, how to control a shutter from Fibaro?
Finally able to create something of a dashboard, but I’m having difficulties deleting an insight. It looks like you should click the trashicon? Doesn’t work
Also when I add another insight, it is saved without clicking on the SAVE button of the dashboard
And a feature request: setting the Y-axis of insights to specific min/max values. That way you can f.e. set the indoortemperature to 18 and 24 degrees and your graph will always give you the same representation (instead of a line that heavily moves when only small changes are measured)
Despite the very steep learning curve I still think this is the best solution to suite my needs. I liked the WYSIWYG approach (more control of where items are placed and no layoutdifference between edit and viewmode) of the old version better, but this version is very advanced and flexible.
Anybody have an idea how to make the spacing better in the left “card”? When I create this using only on column of sensorvalues the insights become too unreadable (imo), when having less sections on the page - thus wider insights - the values are too “spaced out” (see right section)
(Temperatuur .. . . . . . . . . . . .. .. . .. . . . . .. . . . . .. . . . .. . . . . . . . . .. . 22*C)
So I created a section with two colums for sensorvalues, but in the left section, the values of the first column are too close to the description of the second column. I can give the sections that hold the two columns of sensors a larger gap, but this only increases the space between lines.
I would need to place something inbetween the two sections that hold the sensorvalues
This is the setup