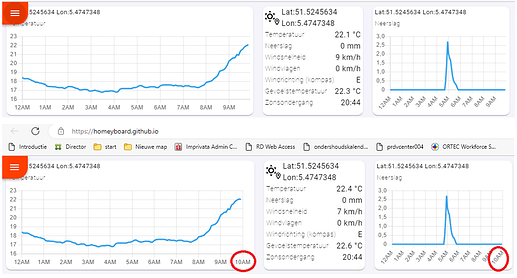
On my Dash most graphs are not updated, but the weather graph is automically updated every 120 seconds
@ Peter_Kawa
I also would like to know howto add the “buienradar” map to the Dash.
Thnx
I also have some suggestions.
Would you like us to use Github Issues for this?
I’m not sure. I think it’s a little easier to just post stuff here, and I’ll try to pick up most of it and add it where I see fit. If I get at ton of issues on GitHub, it might be a little much to manage ![]()
I might change my mind in the future when the project is a little more stable ![]()
cc @Dj_Kolk
Hmmm, not sure if you gonna like this, while it can’t be done with Homey itself:
WhiIe I also use Home Assistant, it’s ‘Buienradar’ integration has a so called camera entity, location dependable, which shows the buienradar animation.
With the Home Assistant Community app on Homey, I could import that entity as ‘camera’
This results in this ‘cam’ device on Homey:
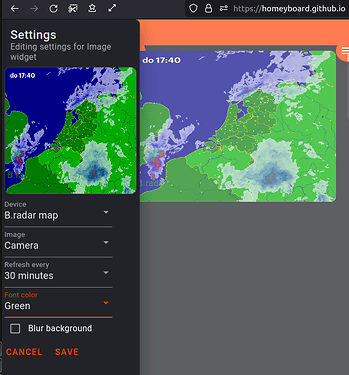
And with the homeyboard, while I was adding my webcams, I noticed the B.radar map device also present in the selection list, and when I selected the image ‘Camera’, it showed the animation ![]()
Thnx Walter,
Unfourtenely I don’t have an instance of Home-assistant running, so bad luck for me.
On the other hand great manual, hope some one else can use it.
May be skogsaas can incorporate this.
(I know hé has a lot on his plate)
Thanx, kind regards, Dj.
-
Then I think the the ‘buienradar’ or other weather app should provide for a similar .gif animation as ‘cam’ capability.
-
Or, if @skogsaas can add a HTML tile one day, this code f.i. can be added
<iframe src="https://gadgets.buienradar.nl/gadget/zoommap/?lat=52.155&lng=5.3875&overname=2&zoom=6&naam=amersfoort&size=2&voor=1" scrolling=no width=256 height=256 frameborder=no></iframe>
2a. Users can create such a link to a card for their own location here:
https://gadgets.buienradar.nl/gadget/zoommap -
Or / And, While I just read about a new feature of Open Meteo app, generating graphs, I found this now possible with Homey, a precipitation (just one of the weather sensors) graph:

Using an advanced virtual device, you can create a Virtual Camera, and then you can send the graph as image to that device.
Flow:
Now you can select it as image @ homeyboard:
This app will be awesome! It fills so many gaps and is a kind of “missing link”. The standard Insigths don’t store your latest graphs, but with this project I will always have a dashboard with all the graphs and timespan I am interested in. ![]()
A question: I guess that the dashboard designs are stored in browser cookies for now. The advantage of this is that I can have a dashboard design in my PC browser and another for my mobile browser. Will it still be possible to have different dashboards when the app is released? The drawback with browser cookies is of course that they can be erased.
I’ve been playing with it for quite some time now and it’s really robuust. No bugs found yet!
Well done ![]()
I also have some suggestions:
Is is possible to add ‘no text’ to the camera

The tiles needs some padding:
and:

When adding a new tile and cancel (at below screen), it creates a empty tile.

Maybe when a tile does not have a device specified, the dashboard should just delete it?
A possibility to edit the names of the capabilities:
I.e. I would like to change ‘Set volume’ to ‘volume’.
Hi @skogsaas, can you make an option to hide names on a card and to make more pages and menu bar? So you can make a main page, energy page, weather page etc etc
I’ll go through everything you describe and make notes of it ![]()
When you add a widget, it actually first adds the widget to the board, and automatically opens the editor for that widget. Pressing cancel just means that you didn’t configure the widget you added. I’ll look into adding a delete button on the editor ![]()
I’m working on making multiple dashboards available, would this be a solution to your request for multiple pages? Or do you want a way of having some dashboards easily available on a toolbar, like tabs?
For example take a look here and scroll down: GitHub - LRvdLinden/homeassistant-config: 🏠 By LRvdLinden -- My Home Assistant configuration. Be sure to 🌟 this repository for updates!
Curtain slider works ![]()

This is great for inspiration! Thank you!
I also understand what you want. Basically different dashboards on a toolbar with icons for selection.
Yes ![]() and that we can self sellect the dashboard collor.
and that we can self sellect the dashboard collor.
Update 0.5.0 - Some Insight love 
Slowly but surely the project is moving forward. I’ve noticed the last few days that I’m receiving a lot of good feedback. Really appreciate it! ![]()
In the previous version, I added a workaround to the HP16/19 insights problem, and posted an issue to Athom. They responded that I’m using a part of the APIs that will be removed in a future version, and should use a different method for retrieving insight log entries. I’ve now implemented this, and as an added benefit you can now not only get insight for device capabilities, but also:
- Homey logic variables
- Homey built-in weather
- Homey app performance
- Homey system performance
Note that the devices are not sorted alphabetically at the moment. Will look into that ![]()
As my day-job is working with high volume time-series data, it’s very painful to see how they have implemented insights. So as an effort to at least display data without the artificial staircases Athom adds to insight data, I’ve added aggregations. This allows you to down-sample the time series with the method of your choosing. Homey actually automatically up-sample your data by doing an back-fill with the latest value. If your sensor reports once every 30 minute, you can now down-sample to 30 minutes, and see more fluid graphs.
Example using the now available Homey Weather from insights. The first graph is without any aggregation, the second is with 1 hour sample rate selecting the first value within each time bucket.
Or another example where I select the average value over every 30 seconds, to remove noise from an
electricity meter that reports every 2.5 seconds.
And last but not least. I’ve now implemented automatic update of insight graphs. When retrieving the insight log entries, Homey reports back how long until the log is updated. This ranges from 5 seconds when you select Last 1 hour resolution, to hours or days when selecting a longer resolution.
As I’ve rewritten insights according to Athom recommendations, and not using the workaround. Please let me know if it stopped working for HP16/19 ![]()
Have a good weekend!
Sounds good!
Is it possible to add a search bar to the device list?
Edit Insights work for Pro 2019, but I just needed to add them as new tiles ![]()
![]()
I’m already planning on doing some auto-complete search stuff ![]()
Can you try to edit and re-select the insight log from the beginning?
I just remembered that I didn’t add an migration for settings. As it just worked out of the box for HP23, I didn’t think about the differences in id and uri for HP16/19.
Edit: I will push an update to try to migrate all old widgets ![]()
Hi, we both were too quick ![]()
It works when I add them again as new tile ![]()
Other thinghy: Firefox on my laptop seems to forget my board after a reboot.
I’ve no auto cookie killer or the likes.
The board at Chrome @ Android survives a reboot.
Is it possible to save the board layout as file or anything (in the future)? I’d like to duplicate it to another device for instance.
No hurries of course, it’s just nice to see the progress and to check this all out.


