Good question… Haven’t seen this anywhere else, but I was able to solve it by using the "Set to and card, which also saves me from converting the value from text to number ![]()

Hi Arie,
Some tests here also show no tag selector for the number input, but the other types seem fine:


Some random other cards seem to suffer from the same “bug”:


But these random cards are OK:


My guess, @Chillout has the honour to report a web app bug ![]()
Thank you for creating this app. I’m hoping to get some advice for my setup.
I’m using this app in combination with the Modbus app to monitor and control my solar panels and home battery. I’ve create 2 virtual devices:
- A device of device class “Solar Panel” to represent my solar panel / inverter.
- A device of device class “Other (Default) to represent the home battery. The current power (Huidig Vermogen) of the battery is setup to be positive when the battery is charging (consuming energy) and negative when the battery is discharging (providing energy).


When I did the initial setup, this made sense as it provided me with an easy way to see current producten by the solar panels and status of the battery. With some of the latest features and enhancements to Homey (Dashboards, Energy tab) it no longer feels right.
The primary reason for this is that Homey does not seem to be recognizing my battery as a home battery. It is not showing up as such in the new energy tab. In fact, it is reported as being the device with the highest consumption. Supposedly 12.6 MWh yesterday. Then again my solar panels supposedly produced 15.9 MWh. No, it’s not a typo, at least not on my side ;).

So my questions:
- Given the MWh production and consumption reports, did I make any errors the setup of my virtual devices?
- How can I get Homey to recognize my home battery virtual device in a proper way?
- Should I merge the 2 virtual devices into one? If so, is there any way to do this without losing historical data?
Thank you for any insights you can provide.
It seems like the latest web app update has been withdrawn: I am not seeing the text indicators anymore on device tiles. Also the Advanced Flow notes have returned to their prior color scheme (which I personally think fits better with dark mode).
Indeed, I also don’t see web app devices’ string status indicators anymore, @SunBeech , nor can I select them anylonger (not restricted to AVD’s though).
It’s not documented (yet):

In short, Arie has to implement all changes needed for the new Energy tab. He’s aware, but busy living. So patience is your friend ![]()
Hi everybody.
I tried to read the whole thread, but got tired of it. ![]()
I want to use an AVD as the primary power meter for my home.
Right now I have an MQTT Hub device showing my values for power (W) and energy (kWh).
But the Homey Energy tab says, that my device would only show actual power draw (W).
Is it possible to create an AVD that is capable of showing power (W) and energy (kWh) in the Energy tab?


Many thanks in advance for any help…
Edit:
So I tried to make a AVD but it also only shows the current power (W).
There is a checkbox which can be checked to do that.
But why the heck isn’t there any option to do that for the energy (kWh)?
I mean, my shelly EM for my heating pumps could be used as power meter in homey and that would also show energy (kWh) in energy tab. But that’s not the device for the whole house.
Am I doing something wrong or is it just impossible with AVD or MQTT Hub device?


Answer is right above your post ![]()
And indeed, the MQTT hub virtual device has everything in place for use with the Energy tab. You could have asked in the MQTT Hub topic btw. ![]()
I see now.
I got confused with the thread.
My fault.
![]()
BORUIDAPLS Tuya Zigbee Smart Socket - Corrected Metering
I have four of cheap smart metering sockets that work as expected, except the power consumption values are reported in W/h.
Disclaimer here: This is my assumption based on rough calculations I made base on the device insights.
Device Information
Device Name: TS011F
Device Model: _TZ3000_ko6v90pg
Device Description: BORUIDAPLS Tuya ZigBee Socket Smart Plug
Other things people need to do to get it working correct?
Select your Device at the marked entries:

TEF:
[tef:AVD:"H4sIAAAAAAACA6WWWY+jSBLHv8oIzcOuXLXmNljaB2wuc2MO24xGrQQSk5jDXDa41d99VTV1jLpbq9YuL4j4R0RG/MhQ5lcshTeUwF3S1NgaU+l+J/z1bIUVFTwOq9gU7ionJ3mCMtEnpITMV6TWmBQhHL04RGJkFb5Iab22ytK02+aBujgRF36uC3rsHpslpMb0wS1UUM/CzI8Uu0iyG8M5ovAIy7EXiBW8MVRpLVV6mWU87fSPmuN4Z1o4BGwPHX7isw5PS2Z0VCY73rmb/5ipSum4hcpzd2n1mHPNCHDJDZVgcmucj1bqgzeN6Tw3XLtMyB3LBU5ruhsjykE9KuI8C9W0Z0fBz8NR1c/mPJqjrxyTTlBEWQ0mIlINorS6Um+9mQPN/uTvUIQI26yTW5qU0Fstjwwh6eCkqvFWnRJ7XpjjVqD6nbpIb05h6UfJWFS+Hk9DH0dRyTa+V3sNofdy1HShbeJJOiBL35byqHRC2FknSlbI4+1+BpRGe3Ph16eA2h6ViaCcsqBpSXJULhyRgQxqHzqj3g55bukyZZRIbmzimBOc5w58i4iT3BbhlOpctgHSdR7CcFmtUK01fSx3UWRtd83OusiTdr9RR2MHA+hE+1yV1W2K0ulkJiNsF45tV5drEhbEXvOSsoTx9S4K5GS28tzd0c47PzovaPYRks6RSM3odCb0vbHxci1aSdtmZr3TPQyU4WKc2zYcI8K165JJ77Z2NVHVwVMvoZ6sT0ZAmA/linNhENwMovEtV/MAJKGq2fR4YmMqzsnE2V2JyLBnyImnerF3zQtxUNwsvAZdmyvatjMJ05Up7YCO1PZwjKxt6XKIZn2kh2PdbiSyV1JyDpi0RB0309a1uHcN7OrR0POpz+L63jCKMop+sgg3OuWcV/XcpNtbBFWaYyl2IacilfCaARprlFMpzOT82qNVc6UDbm9JfiqHdlfhtSzuDa2SK4oJjCEklFKdhEws9gLlduf9pmJgL7TkLTPqRJ0YpV4Cg+I2w4RUwu0VQRD+jT1hydgPTfUylz22/vr2+YX9fkhJwvfoRWxuxIU+O7erT9CVo8b6QnTVoTNq1BG4PB7cnX7I96HmGd7y1ul5RZxakbpwBblYPO5OCfxawLvsaPD2IJ1dySjwbdwuRah3EnecFnCedXZ50EOa8rPtOZD2h5qJt6VjsUpWP5jjbKjKrk/k44GJV4N/PMZ8ojA168AQbiKCjMPsSiqgpuJ6jPmNQ8RooryoWsbxTe1XfEMKkZ8m5ODoOr9oim0S03B1Px/3Qfa4NEd+PDgrgFpzQKtwcYxXt4cZO6dtmh/pphKKhj7s+eXV8eCYCkuXTywXHSVwYOTBDhfKkBsD3qz8DC1brg4p2Je7IkWeumpHiQoZOz64k89BZgW6yTRHgc04MSuSx/VAP0y7zheZQw+r/nwqFsCPbJrqV/5d81ZhvL/u2n43qEe1NR/33d4mg0ORtlLuKuapzJJTKIn1UWxMiZNza3PC7dbeKHFAwkwC1U4o9oj0Q9wSugg3W/UuWDnqIyNDB+GheBXArVZuIxAiQpbZ1GJ66wxN8mxpxXylTbOwPT5uBmkwy3SnGQsk2BdP8wqJZeaA3Q7lWTNuO808UZooScbeeswHhCLHu6rXyiyky0XRfQnXdzJRofBC3ucDGboKzeWT7vtT6/q2G5zIFOHQ5je6v+/7QdgVJsMGG3Yo5FK2yuTS2J7hdc0Fj9RU6S+hCwzKBcahli5tqDTEznD4Mma3Badc0Za5oOaa3Em0cZVA2Pdh1U8hy/N2nt4pPoh421jVpRPYI82K4cathbg+6QZdlolEsRo7aSfCijc2o1UhMS3snjdOGWs9KhsU9GUjCAL27QlrOnRGNSh3KbbGMpqKAWDiZ5ZN2GcaJswzD3n6maCylGQyBudxGnvCejgMqD6/jhysYXeev9xAOcIvL3M4gHrA1vVYlk9YPVYx7OzMh9MgI1imPbbGP83W6/tdID+FTdOUENQ/CdmMw9B8CMSnsAUV7MBPIgzU/33tpOyxNdY3yQUO2LsXYYEKYmvMae6w+7TuYVbCZBBfD/8eW//xFfv99xz0uQ5nbI01cQGTYU3xJPaEoRd+HMOAjOPo55RM6Gc6S5hnQFHJM5VBjmLphE0Agz1h1665wm54yVFB0I8d/HJ9Xfnbnx9re/AKOjDALbiCGJVoQC8VZKDs4adP3tyF/ocs39ePrbE0WadvXXyoQY2Gl+DDh4l8wyC9/FMEb7CLOzAm+afDrxHhcO7/ITLA7gce5C/wIP/G4zPH97X/nAb5TuNyWP7Yr9x0FXiJNMGQ/6trxjr9x++vW35J4Dj+z88AESaoAi97jHrC4tfN+r657NrOMuzDuu0gGKBcNvct6NLPXt7kXyNNUDj7v6Nu6ibLXiG/15TD5ALT72v5r+zffd7Z/5X0w/52Z/44mb9v8Pvf8aGCV23oRvilboYvP3iIqAdx+VHst6e3S/ob7Y29D3ai4Bjeb/44g98idI4h/M2rQPcy9wBb//Hnt/8AKjNbLdkLAAA=":/tef]
You’ll need a Power by the Hour app’s “power summariser” device. Along with values in kWh, It calculates many nice figures (no flows needed):


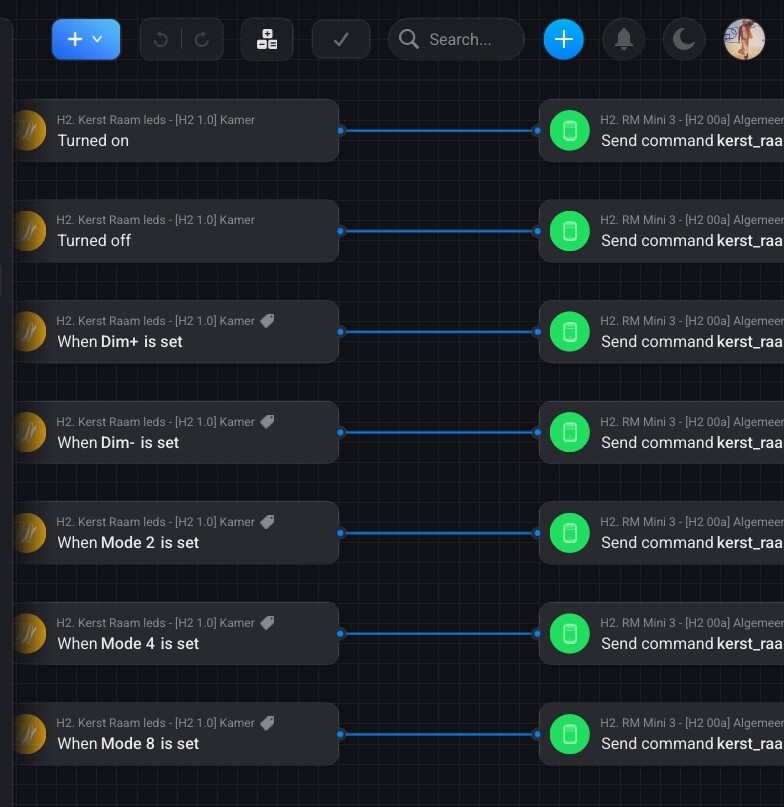
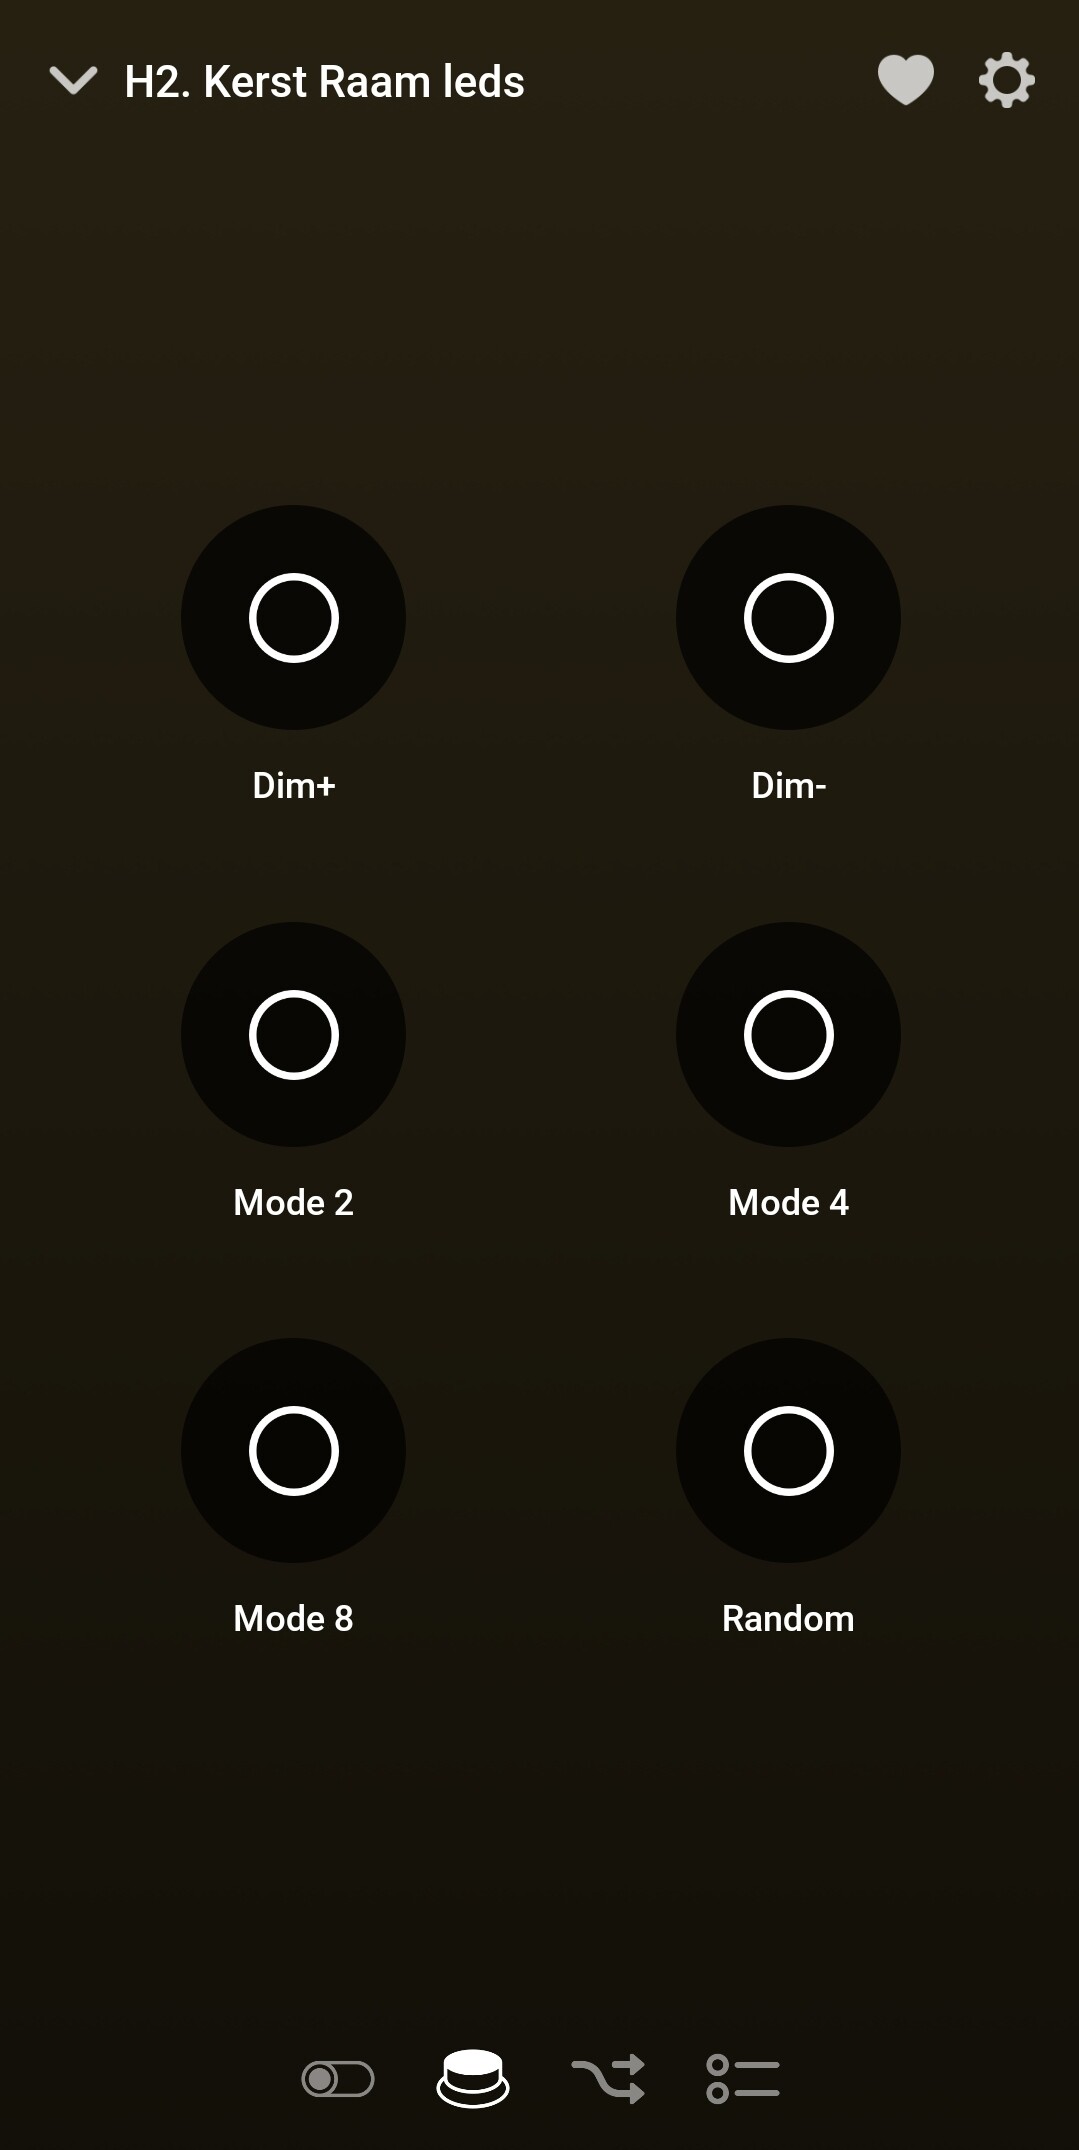
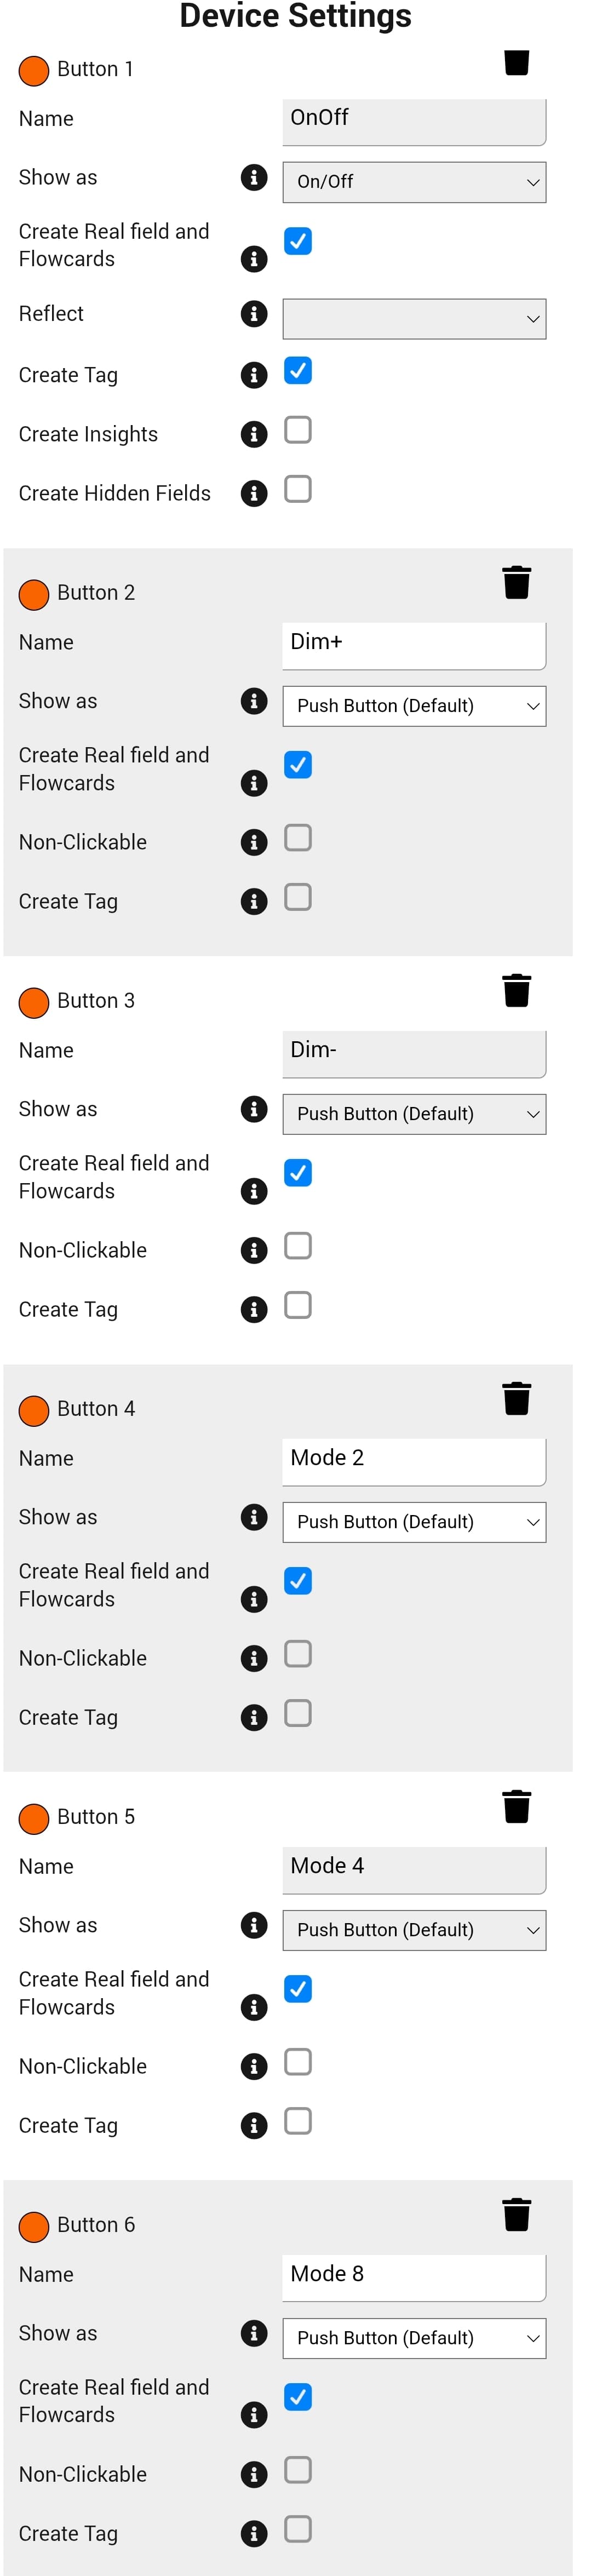
I have flows to move sunshade up, down and stop (using a broadlink rm4 pro incl homey app for it). How can I start these flows with the buttons of this app? I can only select devices. Selecting the rm4 pro as the device doenst give me the necessary options and I dont want to create even more VDs by creating a VD for every input for my sunshade. I am missing something but I dont get where to start with my problem
Thank you so much!
So far I only made flows with my handy app. I had the necessary flows but I didnt know how to include them in AVD. The AVD repair GUI was the wrong place to look for. Now it works using an advanced flow in the web app. It’s good having learned that as I should look into advanced flows more anyway. Thank you.
No problem!
You can do it with standard flows (handy app) as well, but in that case you have to create a flow for each button.
AVD for door lock - how to use lock state as status indicator in the tile??
Good evening,
I am looking for some advice on how to re-create an AVD that represents my Nuki door lock (as I am having a lot of problems with the Nuki Web API, I am using the local API of the bridge).
I more or less was able to get all the capabilities of the original Nuki rebuild as an AVD however I fail to understand how to use the status of the lock (locked, unlocked) as status indicator. If I pick “lock” as a device class I alsways get the symbol of a closed lock. How do I change that to an open one? Any hints? Thanks a million.
Actually, if you look very carefull, the lock is open sometimes. Its just hardly visible.
I am unsure if you can select text as status indicator atm. It was possible, but i think the temporary removed it later on?
@Peter_Kawa do you know perhaps?
