Hi, I’ve been a long time user of Home Assistant and have recently started using Homey on the side to see if I can manage my energy better. I really love the look and feel of the energy board but its lacking one thing: I want to be able to remove the energy my EV uses from the Total Energy graph + cost calculation.
The simple reason: I’m driving my EV leased and my energy consumption is compensated by the lease car company / employer. I would imagine I’m not the only one that has this construction.
When I look at my energy use however it gets “overshouted” when I start charging my car. I can’t see the real details anymore of what my house hold appliances are using
Is there a way to remove this or get a third color which highlights the EV use. And how to recalculate the actual costs as I’m getting refunded for the EV energy used
Well, this IS your house energy usage. You have to pay for indepent on your cashback for the EV part.
You can exclude the EV device from cusomer list in device settings.
But the chart is from your smart meter and provides just the in/out energy. For the chart it doesn’t make a difference.
Yes that’s exactly the issue. The only thing I could do is make the value negative but I do not know how to do this (tips welcome) and it will still screw up my energy chart. Also I’m unable to combine my the phase meter (Shelly 3EM) into one but that’s a cosmetic issue.
The main issue with EV chargers is that they completely “overshout” all other energy users. And since the costs are irrelevant for most lease drivers with a EV charger it would be great to exclude it.
Or show the costs seperately in the house picture above? I don’t know
Excuse me for asking rather than giving a suggestion. I on the other hand would like to se the charger in the garage and how much it consumes/consumed. How do I make this possible?
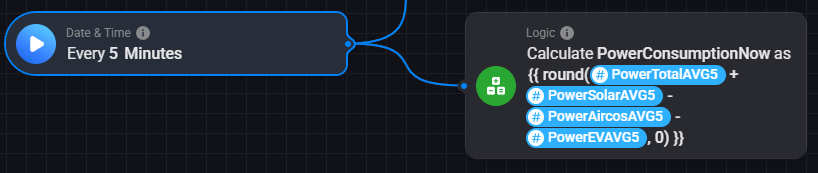
That graph (obviously) shows the grand total of all consumers + production. I also had the desire of a ‘clean’ home energy usage chart, without the obvious consumers/production (EV, aircos, PV).
I found there are some weird spikes in the various powervalues. Even if they’re real enough, its messing with automations based on those values. Thats why I also made rolling averages (medians actually) of the relevant power figures.
Now this PowerConsumptionNow is my ‘clean’ energy usage throughout the day. Easily added as an insight to a dashboard or the app homescreen.
Bonus! If you want to track your home standby usage, find the lowest PowerConsumption throughout a day and save it in a different variable:
(Better to not hijack someone else’s thread, my man.)
But to answer your question, you need something that can actually give you those values. Like a kWh meter (I use this) or maybe the charging-unit itself can provide it (if it’s an connected one).
Maybe you can even get the info from your car, if it supports it, but that would be messy/inaccurate as it’s delayed and not taking charging losses into account etc.