Thanks ! much obliged – I’ll post my config – in the exact same flow that you provided for getting it to work- so I can show where we’re stuck
See – my dashboard for Tuya Smart Developer Center

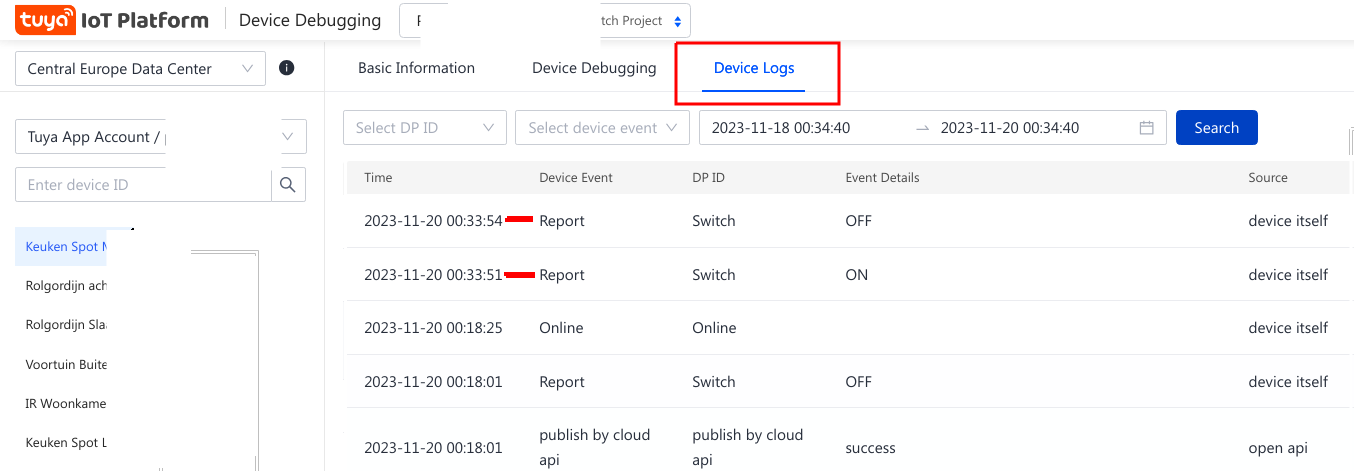
If I compare my info (above) with your layout (below) – nothing stands out. One thing I notice is that my source is listed as the account starts with gg- followed by a longer number – provided in the registration by Tuya – where I noticed the first letter of your ‘source’ is ‘pe’ – something. Don’t know if this is relevant to receiving the message or not

Screenshot from 2023-11-20 00-42-391802×676 94.4 KB
I can’t really interact with the temperature sensor as it does not have any switch to toggle. But for all intents and purposes – I can see the sensors are talking to us. In the debug view – see below.

Also – comparing both – no real obvious differences here ? above is mine – below is yours

Screenshot from 2023-11-20 00-47-531354×471 56.3 KB
.
So – then the flow part – it’s there – seems identical right ?

So – what happens is – this does not result in any message in the log – I even tried actively triggering a simpler test – with a smart plug on/off on/off – nothing.

The results in Simple log:

The only thing shown here are results from an other - not related flow (nachtlamp mode) - that has no relevance to our test.
No entry from any of the devices – where I was expecting a lot of messages by now – or should I not expect a notice for every status change ?
So – I’m thinking the messages from Tuya Cloud either do not get sent – or they aren’t processed correctly. And I can not figure out how to analyze this traffic flow – where is the missing link ?
