[APP][Pro] Dashboard Studio - A completely free-form dashboard designer

Format it like this:

  {"l": "jul", "v": 90.56}, {"l": " ", "v": 91.88}, {"l": " ", "v": 91.55}, {"l": " ", "v": 91.13}, {"l": " ", "v": 90.45}, {"l": " ", "v": 91.2}, {"l": " ", "v": 91.73}, {"l": " ", "v": 90.93}, {"l": " ", "v": 91.19}, {"l": " ", "v": 91.35}, {"l": " ", "v": 91.35}, {"l": " ", "v": 90.64}, 
  {"l": "aug", "v": 88.97}, {"l": " ", "v": 89.38}, {"l": " ", "v": 89.19}, {"l": " ", "v": 88.91}, {"l": " ", "v": 89.8}, {"l": " ", "v": 89.66}, {"l": " ", "v": 89.98}, {"l": " ", "v": 90.07}, {"l": " ", "v": 90.68}, {"l": " ", "v": 90.63}, {"l": " ", "v": 90.38}, {"l": " ", "v": 90.51}, {"l": " ", "v": 91.12}, {"l": " ", "v": 91.73}, {"l": " ", "v": 91.59}, {"l": " ", "v": 92.11}, {"l": " ", "v": 92.0}, {"l": " ", "v": 91.35}, {"l": " ", "v": 91.66}, {"l": " ", "v": 91.25}, {"l": " ", "v": 90.6}, 
  {"l": "sep", "v": 90.49}, {"l": " ", "v": 89.33}, {"l": " ", "v": 89.14}, {"l": " ", "v": 90.37}, {"l": " ", "v": 90.16}, {"l": " ", "v": 90.75}, {"l": " ", "v": 91.05}, {"l": " ", "v": 90.44}, {"l": " ", "v": 90.82}, {"l": " ", "v": 91.14}, {"l": " ", "v": 92.15}, {"l": " ", "v": 91.41}, {"l": " ", "v": 91.77}, {"l": " ", "v": 93.63}, {"l": " ", "v": 93.25}, {"l": " ", "v": 93.46}, {"l": " ", "v": 93.75}, {"l": " ", "v": 93.82}, {"l": " ", "v": 93.65}, {"l": " ", "v": 94.09}, {"l": " ", "v": 94.47}, {"l": " ", "v": 94.52}, 
  {"l": "okt", "v": 95.11}, {"l": " ", "v": 96.19}, {"l": " ", "v": 96.39}, {"l": " ", "v": 97.0}, {"l": " ", "v": 96.41}, {"l": " ", "v": 96.42}, {"l": " ", "v": 96.14}, {"l": " ", "v": 94.4}, {"l": " ", "v": 95.46}, {"l": " ", "v": 95.2}, {"l": " ", "v": 95.76}, {"l": " ", "v": 96.17}, {"l": " ", "v": 95.89}, {"l": " ", "v": 96.95}, {"l": " ", "v": 96.93}, {"l": " ", "v": 96.9}, {"l": " ", "v": 97.61}, {"l": " ", "v": 97.61}, {"l": " ", "v": 98.46}, {"l": " ", "v": 97.78}, {"l": " ", "v": 97.74}, {"l": " ", "v": 98.44}, {"l": " ", "v": 97.47}, 
  {"l": "nov", "v": 97.4}, {"l": " ", "v": 97.21}, {"l": " ", "v": 97.48}, {"l": " ", "v": 96.43}, {"l": " ", "v": 95.54}, {"l": " ", "v": 96.56}, {"l": " ", "v": 97.54}, {"l": " ", "v": 97.22}, {"l": " ", "v": 96.69}, {"l": " ", "v": 95.72}, {"l": " ", "v": 95.16}, {"l": " ", "v": 93.57}, {"l": " ", "v": 93.91}, {"l": " ", "v": 94.09}, {"l": " ", "v": 93.09}, {"l": " ", "v": 93.22}, {"l": " ", "v": 93.88}, {"l": " ", "v": 94.91}, {"l": " ", "v": 94.56}, {"l": " ", "v": 94.83}, 
  {"l": "dec", "v": 95.33}, {"l": " ", "v": 95.01}, {"l": " ", "v": 95.05}, {"l": " ", "v": 95.0}, {"l": " ", "v": 94.88}, {"l": " ", "v": 94.68}, {"l": " ", "v": 94.82}, {"l": " ", "v": 94.51}, {"l": " ", "v": 94.74}, {"l": " ", "v": 94.13}, {"l": " ", "v": 94.76}, {"l": " ", "v": 93.63}, {"l": " ", "v": 93.09}, {"l": " ", "v": 94.05}, {"l": " ", "v": 94.49}, {"l": " ", "v": 94.38}, {"l": " ", "v": 94.28}, {"l": " ", "v": 93.53}, {"l": " ", "v": 94.8}, {"l": " ", "v": 95.24}, {"l": " ", "v": 95.03}, 
  {"l": "jan", "v": 96.85}, {"l": " ", "v": 98.58}, {"l": " ", "v": 99.2}, {"l": " ", "v": 98.04}, {"l": " ", "v": 96.62}, {"l": " ", "v": 98.95}, {"l": " ", "v": 99.43}, {"l": " ", "v": 99.74}, {"l": " ", "v": 99.67}, {"l": " ", "v": 101.16}, {"l": " ", "v": 101.0}, {"l": " ", "v": 99.3}, {"l": " ", "v": 99.18}, {"l": " ", "v": 99.6}, {"l": " ", "v": 100.06}, {"l": " ", "v": 99.99}, {"l": " ", "v": 99.9}, {"l": " ", "v": 100.2}, {"l": " ", "v": 99.85}, {"l": " ", "v": 99.67}, {"l": " ", "v": 100.2}, 
  {"l": "feb", "v": 100.94}, {"l": " ", "v": 99.36}, {"l": " ", "v": 99.32}, {"l": " ", "v": 98.59}, {"l": " ", "v": 99.59}, {"l": " ", "v": 100.0}, {"l": " ", "v": 100.48}, {"l": " ", "v": 100.92}, {"l": " ", "v": 98.83}, {"l": " ", "v": 99.48}, {"l": " ", "v": 99.42}, {"l": " ", "v": 99.64}, {"l": " ", "v": 101.1}, {"l": " ", "v": 100.98}, {"l": " ", "v": 101.9}, {"l": " ", "v": 101.86}, {"l": " ", "v": 102.42}, {"l": " ", "v": 103.36}, {"l": " ", "v": 102.52}, {"l": " ", "v": 102.92}, 
  {"l": "mrt", "v": 101.86}, {"l": " ", "v": 99.26}, {"l": " ", "v": 100.24}, {"l": " ", "v": 99.68}, {"l": " ", "v": 98.12}, {"l": " ", "v": 98.63}, {"l": " ", "v": 100.46}, {"l": " ", "v": 100.24}, {"l": " ", "v": 100.1}, {"l": " ", "v": 100.38}, {"l": " ", "v": 100.96}, {"l": " ", "v": 101.56}, {"l": " ", "v": 100.32}, {"l": " ", "v": 98.03}, {"l": " ", "v": 96.49}, {"l": " ", "v": 97.03}, {"l": " ", "v": 97.7}, {"l": " ", "v": 98.27}, {"l": " ", "v": 97.25}, {"l": " ", "v": 96.31}, {"l": " ", "v": 96.48}, {"l": " ", "v": 96.01}, 
  {"l": "apr", "v": 97.88}, {"l": " ", "v": 97.76}, {"l": " ", "v": 97.33}, {"l": " ", "v": 100.5}, {"l": " ", "v": 100.62}, {"l": " ", "v": 101.18}, {"l": " ", "v": 101.46}, {"l": " ", "v": 102.24}, {"l": " ", "v": 101.76}, {"l": " ", "v": 102.06}, {"l": " ", "v": 102.78}, {"l": " ", "v": 102.72}, {"l": " ", "v": 102.44}, {"l": " ", "v": 102.52}, {"l": " ", "v": 101.94}, {"l": " ", "v": 102.62}, {"l": " ", "v": 101.5}, {"l": " ", "v": 100.74}, {"l": " ", "v": 100.24}, {"l": " ", "v": 102.02}, 
  {"l": "mei", "v": 101.06}, {"l": " ", "v": 102.0}, {"l": " ", "v": 103.74}, {"l": " ", "v": 102.64}, {"l": " ", "v": 102.4}, {"l": " ", "v": 102.28}, {"l": " ", "v": 100.84}, {"l": " ", "v": 101.72}, {"l": " ", "v": 103.06}, {"l": " ", "v": 101.92}, {"l": " ", "v": 102.46}, {"l": " ", "v": 102.8}, {"l": " ", "v": 104.32}, {"l": " ", "v": 104.66}, {"l": " ", "v": 105.62}, {"l": " ", "v": 106.6}, {"l": " ", "v": 105.62}, {"l": " ", "v": 105.32}, {"l": " ", "v": 104.96}, {"l": " ", "v": 104.7}, 
  {"l": "jun", "v": 104.98}, {"l": " ", "v": 106.18}, {"l": " ", "v": 104.98}, {"l": " ", "v": 105.2}, {"l": " ", "v": 104.7}, {"l": " ", "v": 105.06}, {"l": " ", "v": 105.2}, {"l": " ", "v": 105.76}, {"l": " ", "v": 106.9}, {"l": " ", "v": 108.7}, {"l": " ", "v": 108.14}, {"l": " ", "v": 107.56}, {"l": " ", "v": 108.78}, {"l": " ", "v": 108.72}, {"l": " ", "v": 108.38}, {"l": " ", "v": 109.0}, {"l": " ", "v": 107.1}, {"l": " ", "v": 107.16}, {"l": " ", "v": 107.32}, {"l": " ", "v": 106.6}, {"l": " ", "v": 107.12}, {"l": " ", "v": 108.56}, 
  {"l": "jul", "v": 107.88}, {"l": " ", "v": 107.8}, {"l": " ", "v": 108.88}, {"l": " ", "v": 108.74}, {"l": " ", "v": 108.42}, {"l": " ", "v": 108.14}, {"l": " ", "v": 108.86}, {"l": " ", "v": 109.02}, {"l": " ", "v": 109.1}, {"l": " ", "v": 109.52}, {"l": " ", "v": 110.3}, {"l": " ", "v": 109.62}
]

There is a small “bug” when it is empty "", it switches back to a data point number. If you add a space " " it does not see it as empty:

Hi, i came across a new challenge (for me), my normal buttons are working great, but now I have a button that not just has to be on or of when i push it.

The button has an extra condition, it can only be activated when a different button (light) is already on.

example, i have 2 togglebuttons.
Button 1 (livingroomlight) is my normal light on/off and get his state from pushing on it or from a flow that is executed on specific times. (this was the button i asked about last time). and it sets a variable livingroomlight_on to true/false

Button2 (movielight) is the same kind of button but activates a different flow and looks at a different variable livingroomlight_on.
The flow dims the light to a specific value with flows (on = dim to 50%, off dim to 100%), and sets the variable movielight_on to true/false.
all works fine

Now the catch, the movielight flow, has condition that can decide if the main function of the flow (dimming the lights to 50%) is executed or not and thus setting variable movielight_on to true or (keep it) false.
When the result of the flow is false, the button of the dashboard has to stay off. and that is not happening now.
Button2 has its state(on/off) set to movielight_on (the same way I did with the other button(s) but with a different variable)

I have studied the documentation, but i still dont understand DashoardStudio card “send [event] with [value] to Dashbord” and i think that might be my solution/final step.
Ofcourse the [value] isn’t the problem, but I dont understand what name the [event] should get or where to set the name for the event in Dashbord.

it is probabbly again a small thing that i’m forgetting (or im thingking differently on how to approach it)

You define most Dashboard Studio logic in Homey (advanced) flows. You send the result of this logic to the dashboard, which can be, among other things:

  • a variable
  • data for a chart
  • a (Markdown) table
  • an SVG image created by a flow/script


Once the card has been executed with a self-defined EventName and a Value, you can use this EventName as, among other things:

  • a data string
  • a parameter in Dashboard lay-out for one of the settings with a Link option image , for example, showing or hiding a part of the dashboard depending on a formula.

damn, so easy, im overthinking everything.

thanks for the explanation

at my dashboard i visualize the status of window Sensors.

i realize this very oldschool with variables i set to the image:
| :ph-windows-logo: Dach Dominik| {{sensordachfensterdominik2/value}} |

I know, this is not the most elegant way. the “2” variable is only set for the dashboard. What is the most efficient way to realize this, without all those variables?

thanky you

Flow variables are not necessary.


Define an icon in the dashboard:

  • set the sensor to Default State (on/off)
  • define Icon and Active icon with the desired settings (see image below)

Widget label stettings:

If the Window/Door icon is really needed, it must be placed as a separate icon in front of it. To be honest, that extra icon has little added value, because the container is already named “Türen/Fenster”, and the only door is already named “Esszimmer Tür”.

EDIT
An alternative to modernize it a bit:

image
I use SVG images, I drew myself to represent the actual look of the door/window.
I’m using a switch however (linked to the state of the sensor) to show them, because some of them are linked to an action when pressed…

NEW TEST Version 1.11.4

  1. New: Homey app settings - back up your Dashboard Studio configuration.
  2. Improved: Graph widget - object data can include timestamps (t), text labels (l), and values (v) together. Text Labels and time formats each use only their field; empty labels or times stay blank.

Dashboard Studio configuration backup:

It is now possible to backup the Homey Side Dashboard Studio Configuration:

afbeelding

This will generate JSON data that you need to store on your computer because I could not get a save dialog to work from inside Homey. You can import that data later to restore the configuration as best as possible, though if devices are removed it cannot restore those connections.

Next month I will try to release Dashboard Studio 2.0 as a test version with some major changes (Still have to do a lot of work, so no promises). It should be fully backwards compatible, but there are so many changes and new functionality that the testing community over here will probably find some overseen critters. If users want to move from the test version to the stable version it is probably wise to back up the configuration. It should not strictly be necessary because just installing the stable version should work fine, but if you somehow completely remove Dashboard Studio you will lose all user data.

Note 1: This will only save the Homey side configuration. This will not save flows or Dashboard Studio side data like images, user presets, and user dashboards.

Note 2: This backup option is not thoroughly tested. I only tested this in my own environment, so there are no guarantees.

Graph widget

I have improved the data format:

[
  { "t": "2024-01-01T08:00:00Z", "l": "heater", "v": null },
  { "t": "", "v": 100 },
  { "t": "2024-01-01T10:05:00Z", "l": "Other", "v": 105 },
  { "t": "2024-01-01T10:10:00Z", "v": 105 },
  { "t": "2024-01-01T12:00:00Z", "l": "", "v": null }
]

t: is time / date data
l: is labels
v: is value

You can choose between time / data or labels (or points) in the graph configuration. When set to “text labels”, it will not show data points any more for empty label spots.

Note: You can’t put labels in the time key like you did in your first example.

Thanks implementing the non-glow active icon. Much appreciated.

I am using Dashboard Studio 1.11.4 on Homey Pro (Early 2019).
Something strange is happening: for a Text Widget I have bound it to a value, and have selected the Binding Options. Here, I set the Payload Formula to "hello". This shows the original payload value instead of hello.
Payload Formulas do work correctly in Color bindings, so the formula engine itself is functioning. What can possibly be going on?

(This is an example of what goes wrong. Also a normal if fails to evaluate.)

Hi Michel,

I’m developing a Homey app called HCC (Home Control Center).

I would like to send my own data to Dashboard Studio without using Homey Flow cards.

I have already seen that Dashboard Studio internally uses Data Drivers, Topics and onIncomingData(), but I couldn’t determine whether third-party Homey apps are allowed to publish custom Topics directly.

Is there a supported API for another Homey app to publish a custom Topic (for example hcc/energy/prices) with a JSON payload to Dashboard Studio?

Or is the recommended approach to use Flow cards or Homey variables instead?

My goal is simply to display a 24-hour electricity price graph from my own app in the Graph widget.

Thanks!

You should ask in the Dashboard Studio topic:

Indeed. I guessume the dev of the other app should allow your app to connect to it (both on a personal and code level :smiling_face: ).

Currently Dashboard Studio has two drivers which are MQTT over websockets and a direct Homey connection. If you want other apps from outside Homey to send data to it you could use MQTT.


Since your app is a Homey app the direct Homey connection is highly recommended. This gives you the advantage of using specific Homey functions like uploading images, saving presets, automatically resending the latest data, storing dashboards in web storage and much more.
Why would you want to send topics directly from your app anyway? If you want the most direct connection possible just let your app generate a device containing all the available values and enable them inside the Dashboard Studio Homey configuration.

These values become instantly available inside Dashboard Studio and if you format them according to the supported data formats everything should work smoothly.
Just copy the topic, make the data setting of the graph dynamic and paste the topic right in.

If you have a specialised format, you can use a flow to pipe it trough a homeyscript to translate it for Dashboard studio. Also, since you want to show energy prices, you can also use the power by the hour app and send that data directly to a graph widget.

I don’t think it’s easily possible to send data from your app directly to Dashboard Studio because all apps are sandboxed. Using a device and enabling the capabilities is probably the easiest solution and it will keep your app universally useful too.

Thanks. Linking to that topic gave me a notification of this topic :sweat_smile:

The graph below is an (animated) SVG, created with Homeyscript and displayed in Dashboard Studio using Flow cards.
What could be the added value of a separate app?

Some notes regarding the configuration backup:

  • there is a list of what is not backed up, but please tell what is included in the backup, and when to use it, before you start the backup. The same applies to restore.
  • the “Copy to clipboard” button gives an error message behind the “Backup settings” dialog box:
  • can “Device names” and “Enabled capabilities” in the backup JSON be merged into one, so that it is immediately clear in capabilities which GUID belongs to which device (I know that technically they are 2 different entities)
  • which DS data is stored in Homey’s online and local backup?
  • I am not brave enough to try the restore.

just a minor thing, but maybe easy to fix. German Umlaute are not transferred correctly into Dashboard studio, they got replaced by a hyphen, see screenshot, should be wärmepumpe :slight_smile:
image

Agree. Initially I was also thinking along the same line, but this is how I incorporated it in my dashboard.

Your screen looks sleek and well-presented. What did you use to develop the application, and how does the integration with Homey work?

Years ago, I also created my own dashboard, originally to keep an eye on the solar panels that were new at the time, and to gain some experience, as a non-developer, with a low-code programming environment. It was a web app, which meant controlling the home automation wasn’t snappy, and the semi-real-time synchronization also caused a lot of headaches (like: how to manage 50,000 json lines with device info each 5 seconds).

That was until Dashboard Studio (DS) became available early this year. I was able to successfully transfer half of my own screens to DS, which was much faster and more efficient due to the local connection. Thanks to the many requests submitted and the many additions from the app owner/developer/graphic designer, I have now incorporated everything into DS.

Could you share a few other screens that might give me, and other readers on this forum, some new ideas?

Hi Amersfoort,

Thank you for your enthusiastic response.

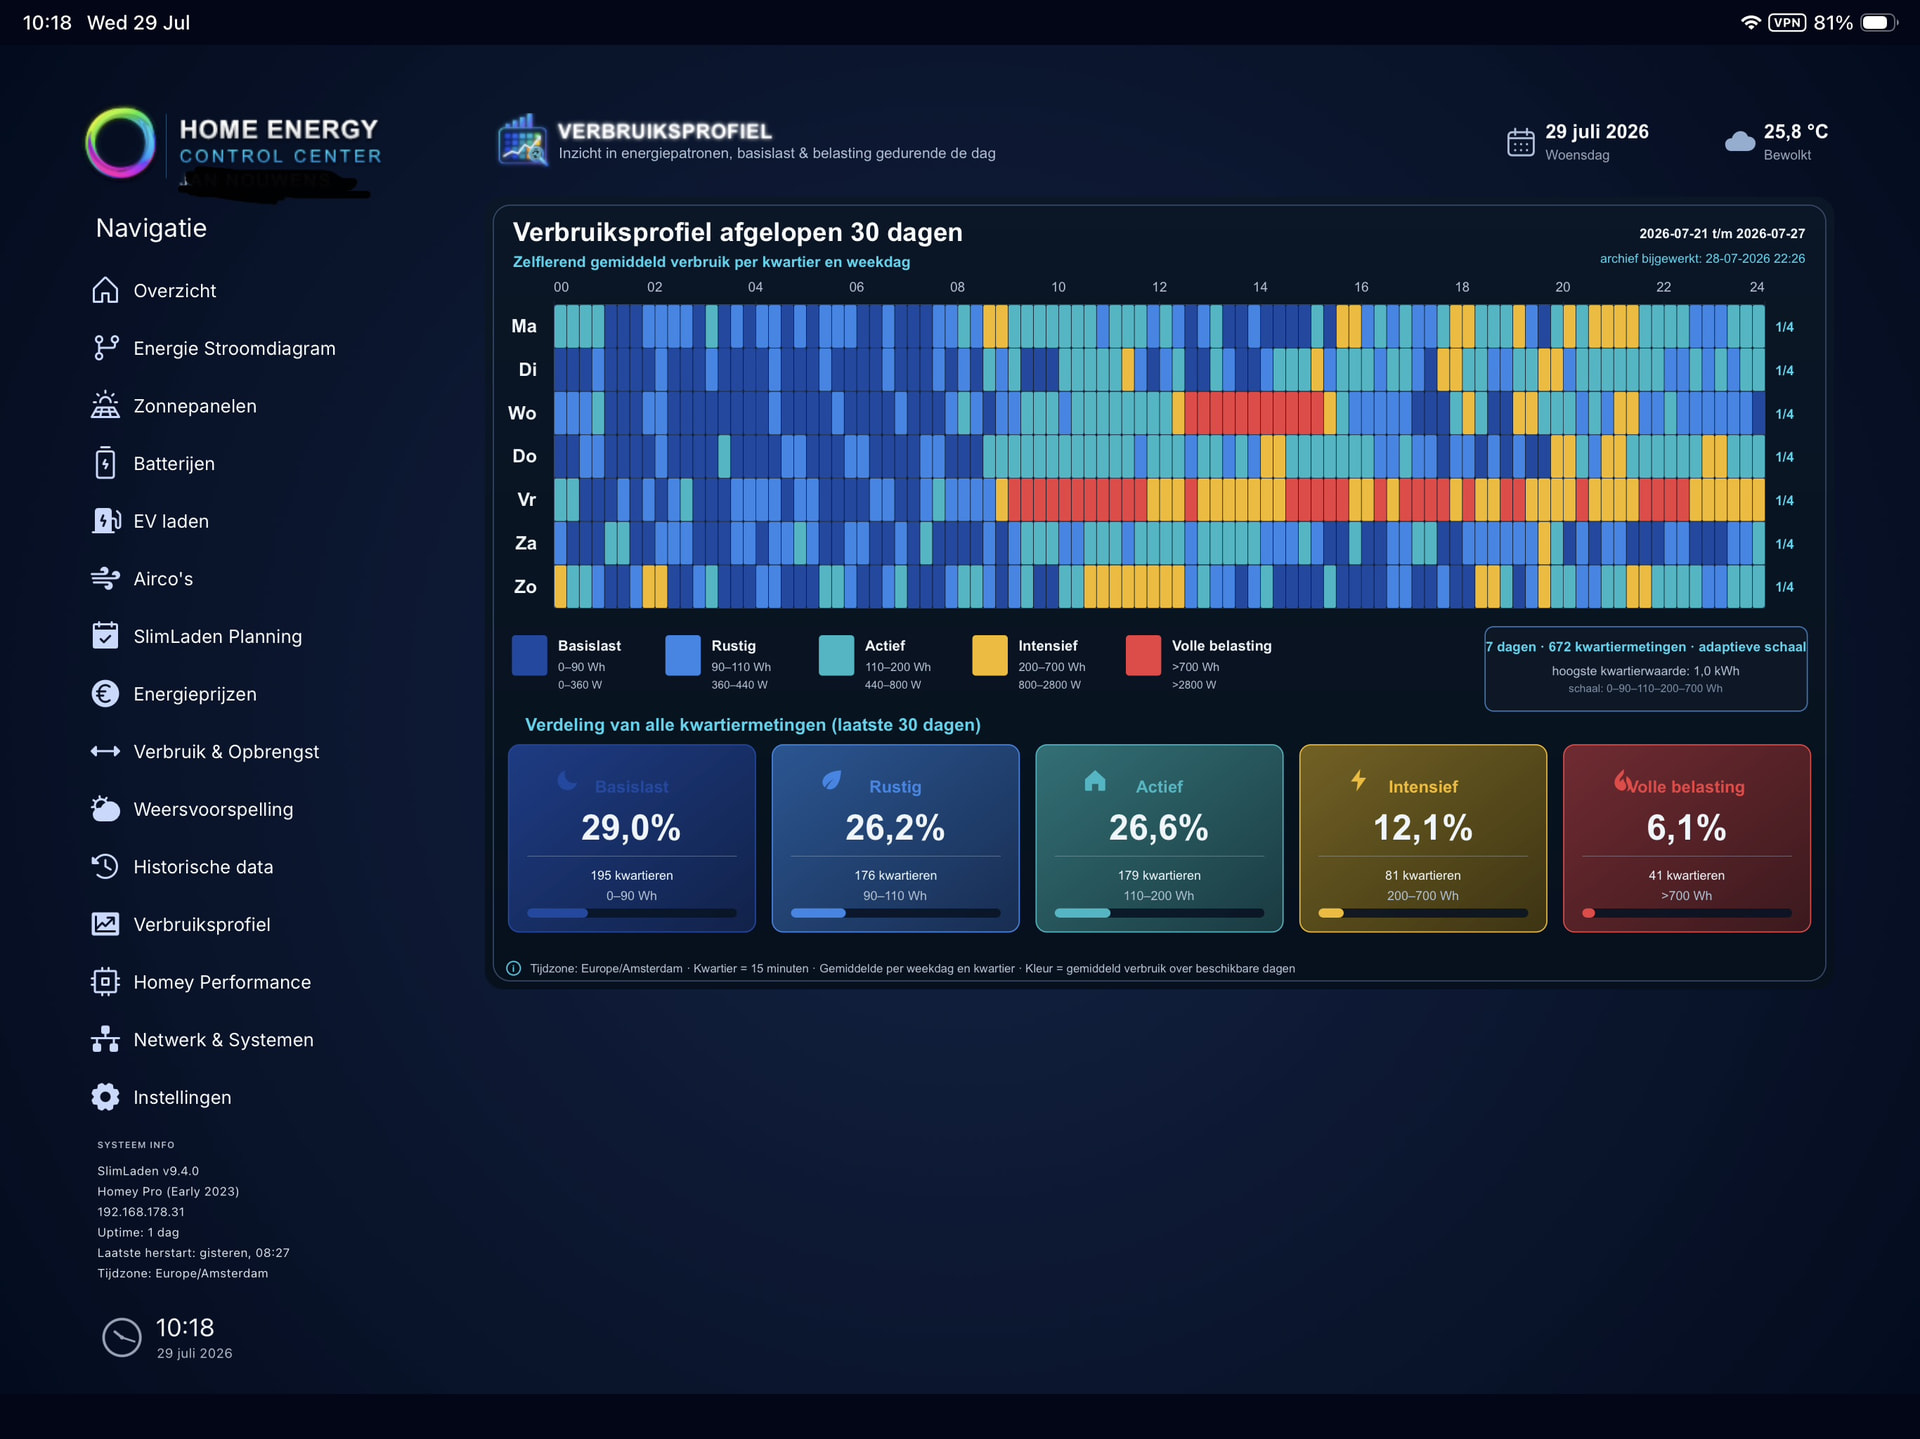
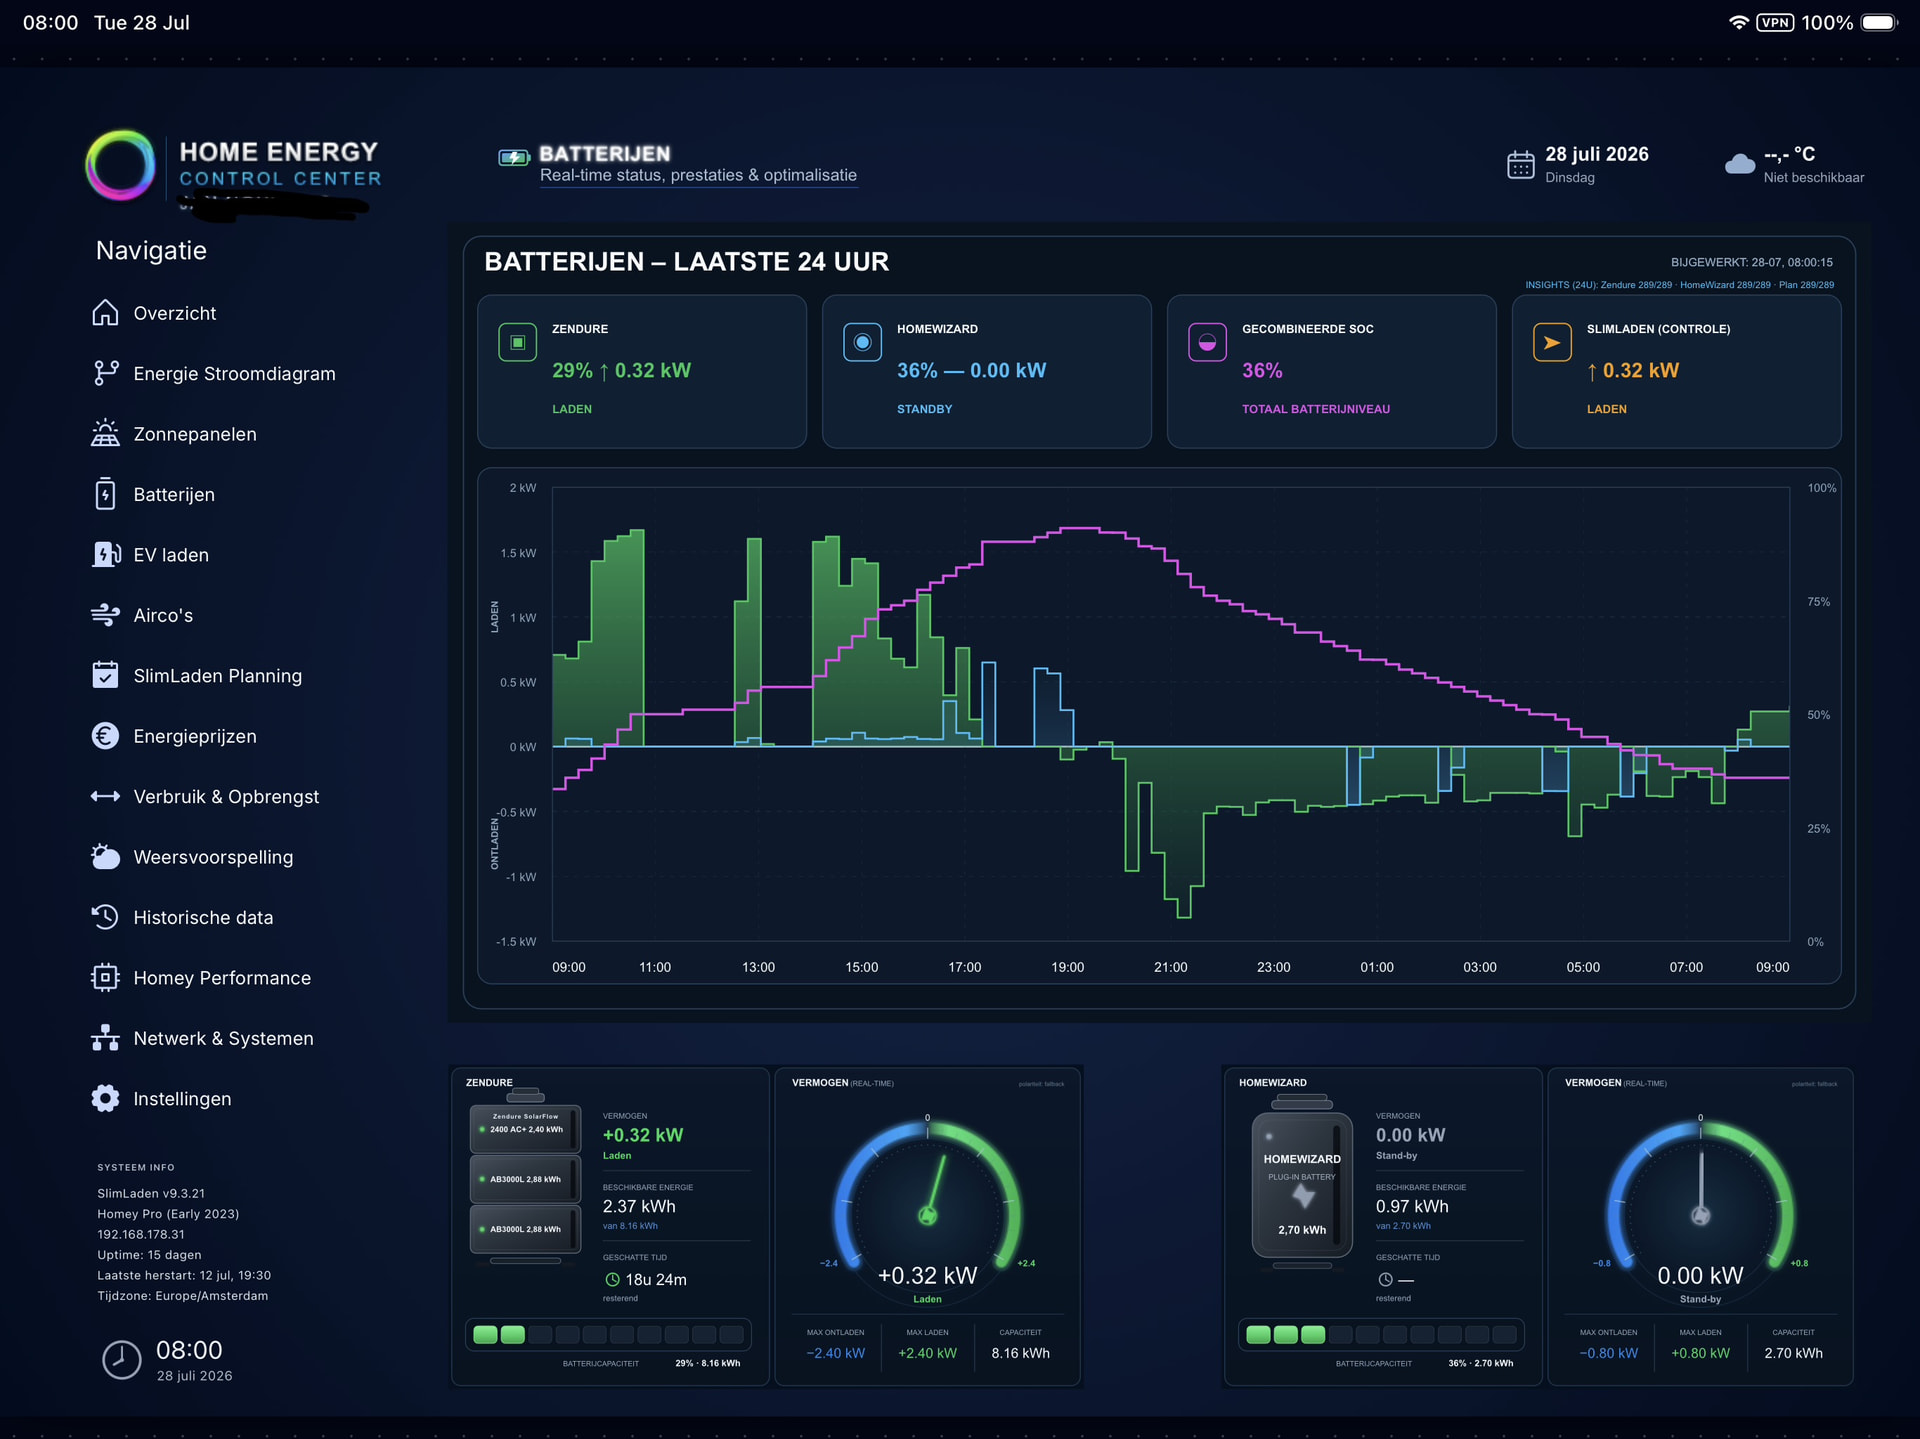
As requested, I have included two additional screenshots of dashboards that I am already quite pleased with. One dashboard shows the charging behavior and status of my batteries; the other contains a heat map of my consumption profile over the past 30 days (it is still collecting data), broken down by quarter hour and by day. In addition, I created a separate Homey performance tab to monitor whether my Homey Pro is not becoming overloaded (still under construction).

The foundation of my dashboard consists of, among other things, a menu, switches, images, flows that call scripts at specific times and/or intervals, and scripts that store and refresh data within a defined time window, for example 7 or 30 days. By using scripts, you can perform a great deal of data manipulation and build the dashboard in a flexible way. I am also trying to find the right balance between processing capacity and keeping the information up to date. Some dashboards have as many as five different timers running.

The dashboard is still very much under development. Not all tabs have content or are completed yet. For example, the first overview tab ‘overzicht’ is still largely empty, because I want to decide only at the end which overviews provide me with the most useful insights.

I also do not want to fully finalize the dashboard yet, because I first want to implement a scheduler for the combination of batteries, EV usage, expected solar panel yield, consumption, and dynamic prices. Among other things, this should allow me to charge my EV intelligently and proactively regulate the output from my solar panels. The scheduler should determine, for the next day, how the energy flows can be controlled in the most optimal way. The Homey app “SmartLoading” already provides a solid basis for this, so I would like to continue using it as the core of my HEMS, also for supplying meaningful data.

I have already complimented Michel before, but Dashboard Studio really is an amazing app where the sky is the limit. The great thing is that if you can think of something, you can usually build it, especially if you are willing to invest the time. And if it does not work right away, Michiel and other users like yourself help think through a solution.

In short, I feel I have already made good progress, but I am certainly not finished with this dashboard yet.

Hope this gives some inspiration!

Kind regards,

Jan