[APP][Pro] Dashboard Studio - A completely free-form dashboard designer

I am not sure what you are trying to create, Florence. Basically, you need to make the “data” setting dynamic by pressing the small chain button:

When you send any text to it from Homey, it will be added to the listbox as a new item:

Besides text, you can also send icons to it like:
ph-warning|Front Door Open

One drawback: if you close the dashboard and open it again, it will only show the last item that was sent to it. If this dashboard is always on on some kind of screen, then this should be fine. But if you open and close or reload this dashboard often and want the whole list to be shown, you can also send a JSON to it in this format:

[
{ "text": "Feed the cat" },
{ "text": "Turn off lights" },
{ "text": "Lock the door" }
]

JSON is like a digital filing cabinet that stores information using simple “label and answer” pairs so computers can easily share it. This will replace the whole list with items. This example only contains text, but it can also provide timestamps, checkboxes, and icons. The easiest method is to create a Homey text variable, enable this variable inside the Homey Dashboard Studio configuration:

Copy the topic and put that in the dynamic data field. Then use a HomeyScript that adds items to the variable (containing the JSON).

AI is very useful for creating these simple HomeyScripts, but it needs to understand the output format. Best way is to also provide it with a part of the help file. If you open the documentation of the list data format and hover above the title, you see a copy button:

This copies the whole help section as markdown to the clipboard. If you paste this into the AI prompt, it understands the format and should be able to create a perfect tailor-made script for you.

Regarding the question about the timestamp: when you add a single line, it automatically uses the timestamp from the moment it is added to the list. If you use the JSON method, you can provide the timestamps directly in the JSON.

Here is a tutorial how to let AI write scripts (though this is for the text widget)

Here is a tutorial how to create an list widget with items that can be updated (add items, remove items check items etc) inside Dashboard studio. But it is a pretty advanced stuff, not beginner friendly :sweat_smile:

If you can tell me exactly what you would like to achieve, I can write the script for you.

That’s exactly the problem that my script resolves… Works like a charm… :nerd_face:

@Satoer Possibly something I overlook, but I am trying to switch off Glow for an icon when it is active. So, no, I do not want to set it to the neutral state, but I do not want an active icon to glow (I have a simple layout). Where do I switch that off? I cannot find it.
If it is not me, i.e. it is not there, then I’d like to request this feature!

Using the new binding options for the first time. Now less flow variables needed, which is powerful, but:

  • Could the topic selection dropdown be made broader, or could a tooltip be used hovering above the dropdown variables?
  • Would an If condition comparing text values be possible, so that even fewer flow variables are needed: if([field]=‘high’,1,0).

I greatly appreciate your detailed documentation; one can read:

  • Some of these operations don’t exist in Windows like image. I can image this must be >=
  • But what about image: do I have to type != or =! or <>

I shall see if I can improve this.

There is already a “boolean payload mapping” option available inside boolean (true / false) settings.

Isn’t that sufficient enough to map text values to true / false?

That is interesting. It should look like this:

Somehow the markdown parser in the DS build in help file is converting it. Never noticed that. The online documentation is showing it correctly, even though it is using the same help file. Thanks, I shall solve this.

It is not you, it is not implemented. I shall add this :+1:

A Friday brainteaser:

I have a page with news headlines. Sometimes the text is too long to display everything at once. I have created a scroll bar so that I can scroll through the SVG text (and photo).

When I click on the next news item (photos on the right), the length of the text can vary. Therefore, the scroll bar needs to move up to show the headline of the next news item.


Setting a Data Configuration Value variable (see the image with the red frame below) to the same value as the maximum value does not work, because this value contains the current position of the scroll bar. How can I dynamically set the scroll bar to the maximum value?

It seems that SVG is not a solution for this.

I switched to a Markdown table with a built-in scroll bar. Limitations:

  • no straight left margin. The first 2 paragraphs consist of 2 columns (text left, photo right); from the 3rd paragraph onwards, it is 1 column
  • text does not wrap completely around the photo
  • no formatting on the photo (rounded corners, shadow).

But, hey, the scrolling works as expected.

Sorry for the late reply. A bit of holiday shenanigans took my time away from DS for a bit :sweat_smile: I read your message a couple of days ago but had not found the time to formulate a thoughtful reply yet. I also think it would be better to improve the markdown in the text widget to accommodate things like this rather than trying to implement them in an SVG. The whole scrollbar thing was pretty much a hack anyway. I learned that markdown is really versatile. I actually made an RSS reader myself:

Code:

// Homey Script: Customizable RSS to Dashboard Markdown Table Generator
// Save this script in your Homey Pro, then assign the output to a Homey variable/tag.

// --- CONFIGURATION ---
const CONFIG = {
  maxItems: 15,            // Total maximum headlines to display across all feeds
  
  // TIMESTAMP COLUMN GRANULAR CONTROLS
  showTimestamp: true,     // Toggle the entire timestamp column on/off
  showTime: true,          // TOGGLE: Show the clock time (e.g., 17:45)
  showDay: true,           // TOGGLE: Show the day (e.g., Today, Yesterday, 29 Jun)
  showTimeAboveDate: true, // TOGGLE: True puts time above date (using <br>), False puts it inline

  showExcerpt: true,       // GLOBAL TOGGLE: Must be true for any excerpts to show
  maxExcerptLength: 240,   // Limit characters to keep the dashboard card clean
  
  showImage: true,         // TOGGLE: Add an image column to the table layout
  imageSize: '200',        // Sizing modifier: '45' for width, 'x45' for height, '45x45' for both

  // COLUMN LAYOUT ORDER
  // Rearrange items here to shift columns around. 
  // Available: 'source', 'image', 'headline', 'timestamp'
  // Note: 'source' automatically vanishes if your feeds list has only 1 item.
  columnOrder: ['source', 'image', 'headline', 'timestamp'],

  // FEEDS REGISTRY
  feeds: [
    {
      url: 'https://hackaday.com/feed/?posts_per_page=20',
      label: 'Tweakers',
      icon: 'browser',     // Ph-icon name
      color: '@markerTint1',
      maxExcerpts: 7
              
    }
  ]
};

// --- CORE LOGIC ---
const COLUMN_META = {
  source: { title: 'Bron', align: ':---' },
  image: { title: 'Afbeelding', align: ':---:' },
  headline: { title: 'Artikel', align: ':---' },
  timestamp: { title: 'Geplaatst', align: ':---:' }
};

async function run() {
  let allItems = [];
  const excerptCounters = {};

  // 1. Fetch and Parse Feeds
  for (const feed of CONFIG.feeds) {
    excerptCounters[feed.url] = 0;
    const items = await fetchAndParseFeed(feed);
    allItems = allItems.concat(items);
  }

  // 2. Chronological Sorting & Slicing
  allItems.sort((a, b) => b.date - a.date);
  allItems = allItems.slice(0, CONFIG.maxItems);

  // 3. Evaluate Active Columns dynamically
  const activeColumns = CONFIG.columnOrder.filter(col => {
    if (col === 'timestamp' && !CONFIG.showTimestamp) return false;
    if (col === 'source' && CONFIG.feeds.length <= 1) return false;
    if (col === 'image' && !CONFIG.showImage) return false;
    return true;
  });

  // 4. Construct Markdown String
  let markdown = '';
  
  // Headers
  markdown += '| ' + activeColumns.map(col => COLUMN_META[col].title).join(' | ') + ' |\n';
  markdown += '| ' + activeColumns.map(col => COLUMN_META[col].align).join(' | ') + ' |\n';

  // Rows
  for (const item of allItems) {
    const rowCells = activeColumns.map(col => {
      switch (col) {
        case 'source':
          const bgPrefix = item.feed.color ? `[cell ${item.feed.color}] ` : '';
          const cleanIcon = item.feed.icon ? item.feed.icon.replace(/^ph-/, '') : '';
          const iconString = cleanIcon ? `:ph-${cleanIcon}|20: ` : '';
          const labelString = item.feed.label || '';
          return `${bgPrefix}${iconString}${labelString}`.trim();

        case 'image':
          if (item.image) {
            const sizeModifier = CONFIG.imageSize ? `|${CONFIG.imageSize}` : '';
            return `![${sizeModifier}](${item.image})`;
          }
          return '';

        case 'headline':
          let cellContent = `### [${item.title}](${item.link} ^)`;
          const maxAllowedExcerpts = item.feed.maxExcerpts !== undefined ? item.feed.maxExcerpts : CONFIG.maxItems;

          if (CONFIG.showExcerpt && item.excerpt) {
            if (excerptCounters[item.feed.url] < maxAllowedExcerpts) {
              cellContent += `<br>[color @textMuted]${item.excerpt}[/color]`;
              excerptCounters[item.feed.url]++;
            }
          }
          return cellContent;

        case 'timestamp':
          return formatRelativeDate(item.date, CONFIG.showTime, CONFIG.showDay, CONFIG.showTimeAboveDate);

        default:
          return '';
      }
    });
    markdown += '| ' + rowCells.join(' | ') + ' |\n';
  }

  // Set flow tag output for your text widgets
  if (typeof global.setTagValue === 'function') {
     await global.setTagValue('dashboard_rss_feed', { type: 'string', title: 'Dashboard RSS Feed' }, markdown);
  }

  console.log(markdown);
  return markdown;
}

// --- HELPERS ---

async function fetchAndParseFeed(feed) {
  try {
    const response = await fetch(feed.url);
    if (!response.ok) throw new Error(`HTTP Status ${response.status}`);
    const xml = await response.text();

    const isAtom = xml.includes('<entry>');
    const nodeRegex = isAtom ? /<entry>([\s\S]*?)<\/entry>/g : /<item>([\s\S]*?)<\/item>/g;
    const nodes = xml.match(nodeRegex);
    
    if (!nodes) return [];

    return nodes.map(node => {
      const title = extractTagValue(node, 'title');
      const link = isAtom ? extractAtomLink(node) : extractTagValue(node, 'link');
      const dateStr = isAtom 
        ? (extractTagValue(node, 'updated') || extractTagValue(node, 'published'))
        : (extractTagValue(node, 'pubDate') || extractTagValue(node, 'dc:date'));
      
      const rawExcerpt = extractTagValue(node, isAtom ? 'summary' : 'description');
      const cleanExcerpt = stripHtmlTags(rawExcerpt);

      return {
        title: cleanMarkdownFormatting(title),
        link: link.trim(),
        excerpt: cleanMarkdownFormatting(cleanExcerpt).substring(0, CONFIG.maxExcerptLength) + (cleanExcerpt.length > CONFIG.maxExcerptLength ? '...' : ''),
        image: extractImageUrl(node),
        date: dateStr ? new Date(dateStr) : new Date(0),
        feed: feed
      };
    });
  } catch (error) {
    console.error(`[Feed Error] Failed fetching ${feed.url}:`, error.message);
    return [];
  }
}

function extractTagValue(xmlBlock, tagName) {
  const match = xmlBlock.match(new RegExp(`<${tagName}(?:\\s+[^>]*)?>([\\s\\S]*?)<\/${tagName}>`, 'i'));
  if (!match) return '';
  return match[1].replace(/<!\[CDATA\[([\s\S]*?)\]\]>/gi, '$1').trim();
}

function extractAtomLink(xmlBlock) {
  const hrefMatch = xmlBlock.match(/<link\s+[^>]*href=["']([^"']+)["']/i);
  return hrefMatch ? hrefMatch[1] : extractTagValue(xmlBlock, 'link');
}

function extractImageUrl(xmlBlock) {
  let match = xmlBlock.match(/<enclosure\s+[^>]*url=["']([^"']+)["']/i);
  if (match) return match[1];

  match = xmlBlock.match(/<media:(?:content|thumbnail)\s+[^>]*url=["']([^"']+)["']/i);
  if (match) return match[1];

  match = xmlBlock.match(/<img\s+[^>]*src=["']([^"']+)["']/i);
  if (match) return match[1];

  return null;
}

function stripHtmlTags(rawText) {
  return rawText.replace(/<[^>]*>/g, ' ').replace(/\s+/g, ' ').trim();
}

function cleanMarkdownFormatting(rawText) {
  return rawText
    .replace(/\|/g, ':') 
    .replace(/[\n\r]+/g, ' ')
    .replace(/&amp;/g, '&')
    .replace(/&lt;/g, '<')
    .replace(/&gt;/g, '>')
    .replace(/&quot;/g, '"')
    .replace(/&#39;/g, "'");
}

function formatRelativeDate(targetDate, showTime, showDay, timeAboveDate) {
  if (!targetDate || isNaN(targetDate.getTime())) return '';
  if (!showTime && !showDay) return '';

  const now = new Date();
  const today = new Date(now.getFullYear(), now.getMonth(), now.getDate());
  const yesterday = new Date(today);
  yesterday.setDate(yesterday.getDate() - 1);
  
  const itemDay = new Date(targetDate.getFullYear(), targetDate.getMonth(), targetDate.getDate());
  const clockTime = targetDate.toLocaleTimeString('en-GB', { hour: '2-digit', minute: '2-digit' });

  let dateStr = '';
  if (itemDay.getTime() === today.getTime()) {
    dateStr = 'Today';
  } else if (itemDay.getTime() === yesterday.getTime()) {
    dateStr = 'Yesterday';
  } else {
    dateStr = targetDate.toLocaleDateString('en-GB', { day: 'numeric', month: 'short' });
  }

  // Handle individual toggle combinations cleanly
  if (showTime && showDay) {
    return timeAboveDate ? `${clockTime}<br>${dateStr}` : `${dateStr} ${clockTime}`;
  } else if (showTime) {
    return clockTime;
  } else if (showDay) {
    return dateStr;
  }
  return '';
}
return run();

Or a stock / crypto tracker:

// Homey Script: Crypto Dashboard Price & Performance Tracker
// Save this script in your Homey Pro, then assign the output to a Homey variable/tag.

// --- CONFIGURATION ---
const CONFIG = {

  vsCurrency: 'usd',       // Target conversion currency (usd, eur, gbp, etc.)
  currencySymbol: '$',     // Visual symbol to display in front of prices

  // COINS REGISTRY
  // Added an optional 'linkId' field to route web links correctly where API IDs differ
  coins: [
    { id: 'bitcoin',         symbol: 'BTC' },
    { id: 'ethereum',        symbol: 'ETH' },
    { id: 'binancecoin',     symbol: 'BNB', linkId: 'BNB' },
    { id: 'ripple',          symbol: 'XRP'}, 
    { id: 'solana',          symbol: 'SOL' }, 
    { id: 'tron',            symbol: 'TRX' }   
  ],

  // IMAGE / ICON CONTROLS
  showImage: true,         // Toggle icon column visibility
  imageSize: 'x35',        // Forces icon height to 35px

  // 7D SPARKLINE GRAPH CONTROLS
  showGraph: true,         // TOGGLE: True creates a minimalist trend graph column
  graphWidth: 35,          // Width of the chart in pixels
  graphHeight: 15,         // Height of the chart in pixels
  
  // GRAPH STYLE OPTIONS
  graphOptions: {
    borderWidth: 1,        // Thickness of the trend line (default: 2)
    lineTension: 0.4,      // Smoothness (0 = straight sharp angles, 0.4 = smooth curves)
    fill: true,           // Set to true to add a translucent fill under the line
    pointRadius: 0         // Size of individual price points (0 = clean line)
  },

  // IMAGE SILHOUETTE TINTING (Fills transparent logo artwork with a solid color)
  tintIcon: false,         // GLOBAL DEFAULT: Set to true to tint all icons by default
  tintColor: '@icon',      // GLOBAL DEFAULT: Target theme token or hex fill color

  // COLUMN-WIDE BACKGROUND (Applies a background token to the entire Icon column)
  showIconColumnBg: false, // TOGGLE: Set to true to give the entire icon column a background
  iconColumnBgColor: '@surfaceAlt', // Target theme token or hex for the column background

  // TREND COLORING 
  colors: {
    positive: '#22C55E',   // Elegant green for market gains
    negative: '#EF4444'    // Clean red for market losses
  },

  // COLUMN LAYOUT ORDER
  // Matches your exact layout sequence with the Icon on the far left
  columnOrder: ['image', 'headline', 'price', 'graph']
};

// --- CORE ENGINE ---
const COLUMN_META = {
  image: { title: 'Icon', align: ':---:' },
  headline: { title: 'Coin', align: ':---' },
  price: { title: 'Price (24h / 7d)', align: '---:' },
  graph: { title: '7d Trend', align: ':---:' }
};

async function run() {
  const coinIds = CONFIG.coins.map(c => c.id).join(',');
  const url = `https://api.coingecko.com/api/v3/coins/markets?vs_currency=${CONFIG.vsCurrency}&ids=${coinIds}&price_change_percentage=24h,7d&sparkline=true`;

  try {
    const response = await fetch(url);
    
    if (response.status === 429) {
      throw new Error("CoinGecko rate limit reached. It will resolve automatically on the next run refresh.");
    }
    if (!response.ok) {
      throw new Error(`HTTP Error Status ${response.status}`);
    }

    const data = await response.json();
    const finalDataList = [];

    // Process every coin in your registry sequentially
    for (const configCoin of CONFIG.coins) {
      let coin = data.find(item => item.id === configCoin.id);

      // FALLBACK ENGINE: Direct single lookup if the batch endpoint drops a token
      if (!coin) {
        console.log(`[API Fallback] Direct fetching missing asset data for: ${configCoin.id}`);
        try {
          const fallbackUrl = `https://api.coingecko.com/api/v3/coins/${configCoin.id}?localization=false&tickers=false&market_data=true&community_data=false&developer_data=false&sparkline=true`;
          const fallbackResp = await fetch(fallbackUrl);
          
          if (fallbackResp.ok) {
            const fbData = await fallbackResp.json();
            
            coin = {
              id: fbData.id,
              name: fbData.name,
              symbol: fbData.symbol,
              image: fbData.image?.small || fbData.image?.thumb,
              current_price: fbData.market_data?.current_price?.[CONFIG.vsCurrency],
              price_change_percentage_24h_in_currency: fbData.market_data?.price_change_percentage_24h_in_currency?.[CONFIG.vsCurrency],
              price_change_percentage_7d_in_currency: fbData.market_data?.price_change_percentage_7d_in_currency?.[CONFIG.vsCurrency],
              sparkline_in_7d: {
                price: fbData.market_data?.sparkline_7d?.price
              }
            };
          }
        } catch (fallbackError) {
          console.error(`[Fallback Failure] Target asset ${configCoin.id} could not be reached:`, fallbackError.message);
        }
      }

      if (coin) {
        finalDataList.push(coin);
      } else {
        finalDataList.push({
          id: configCoin.id,
          symbol: configCoin.symbol,
          name: 'Syncing Layer...',
          current_price: null
        });
      }
    }

    // Evaluate Active Columns dynamically
    const activeColumns = CONFIG.columnOrder.filter(col => {
      if (col === 'image' && !CONFIG.showImage) return false;
      if (col === 'graph' && !CONFIG.showGraph) return false;
      return true;
    });

    // Build Table Header Framework
    let markdown = '| ' + activeColumns.map(col => COLUMN_META[col].title).join(' | ') + ' |\n';
    markdown += '| ' + activeColumns.map(col => COLUMN_META[col].align).join(' | ') + ' |\n';

    // Parse Asset Rows out to Markdown
    for (const coin of finalDataList) {
      const configCoin = CONFIG.coins.find(c => c.id === coin.id);
      const displaySymbol = configCoin ? configCoin.symbol : coin.symbol.toUpperCase();
      
      const change24h = coin.price_change_percentage_24h_in_currency ?? coin.price_change_percentage_24h;
      const change7d = coin.price_change_percentage_7d_in_currency ?? coin.price_change_percentage_7d;
      const isPositive7d = (change7d ?? 0) >= 0;

      const rowCells = activeColumns.map(col => {
        switch (col) {
          case 'image':
            const bgPrefix = CONFIG.showIconColumnBg ? `[cell ${CONFIG.iconColumnBgColor}] ` : '';
            const shouldTint = configCoin.tintIcon !== undefined ? configCoin.tintIcon : CONFIG.tintIcon;
            const activeTintColor = configCoin.tintColor !== undefined ? configCoin.tintColor : CONFIG.tintColor;
            
            let imgModifiers = [];
            if (CONFIG.imageSize) imgModifiers.push(CONFIG.imageSize);
            if (shouldTint) imgModifiers.push(activeTintColor);
            
            const modifierString = imgModifiers.length > 0 ? '|' + imgModifiers.join('|') : '';
            return coin.image ? `${bgPrefix}![logo${modifierString}](${coin.image})` : `${bgPrefix}:ph-arrows-clockwise:`;

          case 'headline':
            // Renders standard text if the coin data is still pending, otherwise wraps the symbol in a link
            if (coin.current_price === null) {
              return `**${displaySymbol}**<br>[color @textMuted]${coin.name}[/color]`;
            }
            const activeLinkId = configCoin.linkId || configCoin.id;
            const geckoUrl = `https://www.coingecko.com/en/coins/${activeLinkId}`;
            return `[**${displaySymbol}**](${geckoUrl} ^)<br>[color @textMuted]${coin.name}[/color]`;

          case 'price':
            if (coin.current_price === null) return '[color @textMuted]Pending[/color]';
            const priceText = `${CONFIG.currencySymbol}${formatSmartPrice(coin.current_price)}`;
            const c24h = formatPerformancePercentage(change24h);
            const c7d = formatPerformancePercentage(change7d);
            return `${priceText}<br>${c24h} / ${c7d}`;

          case 'graph':
            if (!coin.sparkline_in_7d?.price) return '[color @textMuted]—[/color]';
            const sparklineUrl = buildSparklineChartUrl(coin.sparkline_in_7d.price, isPositive7d);
            return `![sparkline](${sparklineUrl})`;

          default:
            return '';
        }
      });

      markdown += '| ' + rowCells.join(' | ') + ' |\n';
    }

    // Export tag output to Homey Advanced Flows
    if (typeof global.setTagValue === 'function') {
       await global.setTagValue('crypto_prices_table', { type: 'string', title: 'Crypto Prices Table' }, markdown);
    }

    console.log(markdown);
    return markdown;

  } catch (error) {
    console.error('[Market Data Error]:', error.message);
    return `### Crypto Tracker Offline\n[color #EF4444]${error.message}[/color]`;
  }
}

// --- DATA FORMATTING HELPERS ---

function buildSparklineChartUrl(priceArray, isPositive) {
  if (!priceArray || priceArray.length === 0) return '';
  
  const points = [];
  const step = Math.ceil(priceArray.length / 24);
  for (let i = 0; i < priceArray.length; i += step) {
    if (priceArray[i] !== undefined) points.push(Number(priceArray[i].toFixed(4)));
  }

  const trendColor = isPositive ? CONFIG.colors.positive : CONFIG.colors.negative;
  
  const fillBg = CONFIG.graphOptions.fill 
    ? (isPositive ? CONFIG.colors.positive + '20' : CONFIG.colors.negative + '20') 
    : 'transparent';
  
  const chartConfig = {
    type: 'line',
    data: {
      labels: points.map(() => ''),
      datasets: [{
        data: points,
        borderColor: trendColor,
        borderWidth: CONFIG.graphOptions.borderWidth || 2,
        fill: CONFIG.graphOptions.fill ? 'origin' : false,
        backgroundColor: fillBg,
        lineTension: CONFIG.graphOptions.lineTension !== undefined ? CONFIG.graphOptions.lineTension : 0.4,
        pointRadius: CONFIG.graphOptions.pointRadius || 0
      }]
    },
    options: {
      legend: { display: false },
      scales: {
        xAxes: [{ display: false }],
        yAxes: [{ display: false }]
      }
    }
  };

  const encodedConfig = encodeURIComponent(JSON.stringify(chartConfig));
  return `https://quickchart.io/chart?w=${CONFIG.graphWidth}&h=${CONFIG.graphHeight}&bkg=transparent&c=${encodedConfig}`;
}

function formatSmartPrice(price) {
  if (price === undefined || price === null) return '-';
  if (price >= 100) {
    return price.toLocaleString('en-US', { minimumFractionDigits: 2, maximumFractionDigits: 2 });
  }
  if (price >= 1) {
    return price.toLocaleString('en-US', { minimumFractionDigits: 2, maximumFractionDigits: 4 });
  }
  
  const priceString = price.toString();
  if (priceString.includes('e')) return price.toFixed(8); 
  
  const zeroMatch = priceString.match(/^0\.0+/);
  if (zeroMatch) {
    const leadingZerosCount = zeroMatch[0].length - 2;
    return price.toFixed(Math.max(6, leadingZerosCount + 4));
  }
  
  return price.toFixed(4);
}

function formatPerformancePercentage(percentage) {
  if (percentage === undefined || percentage === null) return '[color @textMuted]---[/color]';
  
  const isPositive = percentage >= 0;
  const directionalPrefix = isPositive ? '▲' : '▼';
  const absoluteValue = Math.abs(percentage).toFixed(2);
  const uiColor = isPositive ? CONFIG.colors.positive : CONFIG.colors.negative;

  return `[color ${uiColor}]${directionalPrefix}${absoluteValue}%[/color]`;
}

return run();

It won’t be high on the priority list, but I shall add these things like the word wraping and image styling on the list.

NEW TEST Version 1.11.3

  • Improved: Payload Formulas accept quoted text and can compare string values from live data.
  • Improved: Text settings - Binding Options include Payload Formula to turn live data into display text.
  • Improved: Color settings - Binding Options include Payload Formula to pick a color or theme token from live data.
  • Fixed: Help editor shows formula operators like <= as plain tekst.
  • Fixed: Text widget - removed unnecessary horizontal scrollbar when content fits inside the widget.
  • New: On Homey, your saved templates now appear in the Select Template dropdown.
  • New: Icon widget - Glow on Active setting to turn off the active-state glow.

Icon widget:

This is now implemented :+1: :

Formula bindings:

The formula bindings are now compatible with text comparisons. Also text settings now accept formulas so you can change the text based on a boolean or numeric payload.
See the following help sections:
String, color, and theme-token literals
and
Text payload formulas

This is fixed in the help file now:

It was just the help-file parser (not the formulas). the help file parser automatically changed things like >= to the combined symbol.

Text widget

This is fixed :+1:

UI

The custom user themes are now selectable in the theme & templates dropdown:

(But only when the platform is Homey)

No need to say sorry. I appreciate your software very much and all the detailed answers you give. I don’t expect to receive reactions the same day. It is a hobby after all.

This is the best I can achieve with a Markdown table right now, including rounded image corners with shadow, where the images retain their original aspect ratios (thanks to a lot of AI effort).

Thanks for the new functions. I will try this out soon.

Haha, it’s interesting how many hoops an AI will jump through to satisfy the user. I have no idea how it has managed this. My guess is that it’s using an external service to convert the images? :sweat_smile:

Steps to integrate an image into the Markdown table (alternatives, like external services, had CORS/Cross domain issues or did not display a nice image):
The image processing Homey script part:

  • Fetch & Buffer: Retrieves the raw image from the URL and converts it into a binary Buffer.
  • Base64 Encoding: Transforms the binary image data into a Base64 string for embedding.
  • SVG Container: Places the image inside an <svg> element with defined dimensions and styling (rounded corners via clipPath and drop shadow via feDropShadow).
  • Image Scaling: Uses preserveAspectRatio="xMidYMid slice" to ensure the image covers the defined area proportionally, cropping any overflow to fit the container perfectly.
  • Markdown Embedding: Converts the final SVG code into a Base64-encoded Data URI and inserts it into the Markdown table.

In broad strokes, I understand what is happening, but I wouldn’t have come up with it myself. Just to be safe, I had the points above generated by AI based on the Homey script code.

For me, Gemini is better suited than Chat GPT for Homey scripts, although dozens of iterations were needed to achieve the above.

wow that is smart haha.

Hello,

At first thank you for this wonderfull app, I like it.

I have create a Homey flow boolean variable “livingroom_light_is_on”, that is changed by 2 flows (livingroom_on and livingroom_off)
The variable and the light(bulb) is activated/made available in the DashboardStudio config.
On my page I have a toggle button that that toggles the lightbulb (works great)
And my 2 flows livingroom_on and livingroom_off are listening to the lightbulb and change the value of the variable livingroom_light_is_on (works great)
But im running into 3 problems/challenges I cant get to work properly.

Now my first challenge:
When I start the dashbord in viewermode, the togglebutton doesn’t read or do anything with the variable livingroom_light_is_on. So when the light is on (livingroom_light_is_on = true) my button is still off
The state of the togglebutton is set to the variable livingroom_light_is_on.
I do not know if I am doing something wrong or impossible.

The second challenge is:
When I use the same dashboard on 2 different devices, changing the state of the togglebutton on device 1, doesn’t effect the same button on device 2, so i have 2 devices one saying the lightbulb is on and the other saying the light is off.
I would like to be able to synchronize the button across oll devices
The “Enable Topic Auto-Echo” is on.

The thirt challenge:
The lightbulb is also automated to turn on at a specific time by a diffrent homey flow, but it also changes the state of variaable livingroom_light_is_on.
So the dashboards shoul be able to see that the variable is changed and therefor change the state of the togglebutton.

Is there something that i’m missing?

Thanks in advance for any help or golden tips

Niels

Ps. still new to Homey and DashbordStudio.

The main problem is that variables are read only. You can see this by the “R” tag in the device list:


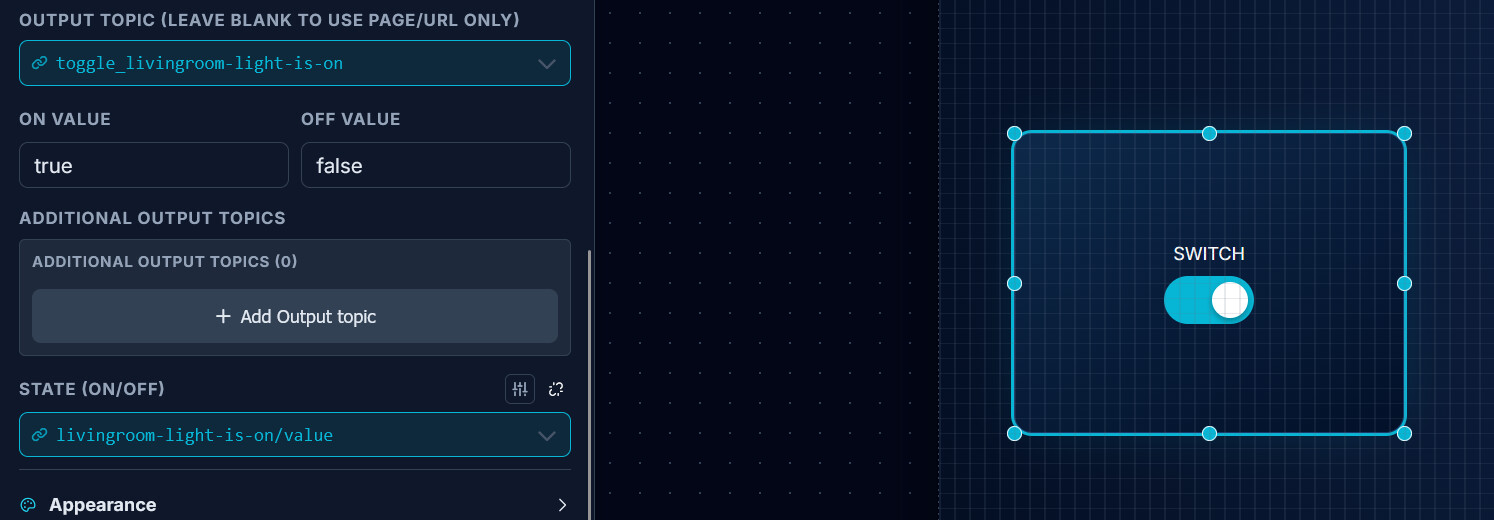
Second problem is that you need to use the whole topic in the topic in the dynamic setting of Dashboard studio. Easiest is just to use the “copy topic” button. In this case the result will be:
livingroom-light-is-on/value
You can also see all incoming topics with their payloads in the data stream explorer:

There is a simple way to write the variable though (To overcome the problem with read only variables). Just add a custom topic name inside the output topic:


(I did toggle_livingroom-light-is-on)
and create a simple flow that sets the variable inside Homey:

I think your other two probems will be solved as well when you fix the above :slightly_smiling_face:
Otherwise let me know :+1:

Ohhh yeah,

This is great, i had almost done everything correct, but I wanted to do to much in Dashboard Studio.
the custom output topic name was the missing link and instead of using the additional output topic to turn on the light, i did that via the flow with the dashboard trigger.

id did had to use a new togglebutton to get it working properly (i think i broke my previous one :slight_smile: )

But now it works exactly as it should, across all my devices with dashboards.

Thank you very mucht for giving me the golden tip, now I have enough confidence to push on with all my devices and lights.

I am trying to create a chart. Due to the size of the JSON file containing 250 data points (= number of working days past 12 months), I left the “t” value empty; only the first “record” of each month contains a 3-character month name.

When I set the x-axis format to “Text labels”, I expect to see these month names, but I only see the number of data points.

How can I ensure that only the month names are displayed on the x-axis?

Can you put the json you are sending in the chat here?

The json with values “v” and once a month a 3 character month name “t”:

[{'t':'jul','v':90.56},{'t':'','v':91.88},{'t':'','v':91.55},{'t':'','v':91.13},{'t':'','v':90.45},{'t':'','v':91.20},{'t':'','v':91.73},{'t':'','v':90.93},{'t':'','v':91.19},{'t':'','v':91.35},{'t':'','v':91.35},{'t':'','v':90.64},{'t':'aug','v':88.97},{'t':'','v':89.38},{'t':'','v':89.19},{'t':'','v':88.91},{'t':'','v':89.80},{'t':'','v':89.66},{'t':'','v':89.98},{'t':'','v':90.07},{'t':'','v':90.68},{'t':'','v':90.63},{'t':'','v':90.38},{'t':'','v':90.51},{'t':'','v':91.12},{'t':'','v':91.73},{'t':'','v':91.59},{'t':'','v':92.11},{'t':'','v':92.00},{'t':'','v':91.35},{'t':'','v':91.66},{'t':'','v':91.25},{'t':'','v':90.60},{'t':'sep','v':90.49},{'t':'','v':89.33},{'t':'','v':89.14},{'t':'','v':90.37},{'t':'','v':90.16},{'t':'','v':90.75},{'t':'','v':91.05},{'t':'','v':90.44},{'t':'','v':90.82},{'t':'','v':91.14},{'t':'','v':92.15},{'t':'','v':91.41},{'t':'','v':91.77},{'t':'','v':93.63},{'t':'','v':93.25},{'t':'','v':93.46},{'t':'','v':93.75},{'t':'','v':93.82},{'t':'','v':93.65},{'t':'','v':94.09},{'t':'','v':94.47},{'t':'','v':94.52},{'t':'okt','v':95.11},{'t':'','v':96.19},{'t':'','v':96.39},{'t':'','v':97.00},{'t':'','v':96.41},{'t':'','v':96.42},{'t':'','v':96.14},{'t':'','v':94.40},{'t':'','v':95.46},{'t':'','v':95.20},{'t':'','v':95.76},{'t':'','v':96.17},{'t':'','v':95.89},{'t':'','v':96.95},{'t':'','v':96.93},{'t':'','v':96.90},{'t':'','v':97.61},{'t':'','v':97.61},{'t':'','v':98.46},{'t':'','v':97.78},{'t':'','v':97.74},{'t':'','v':98.44},{'t':'','v':97.47},{'t':'nov','v':97.40},{'t':'','v':97.21},{'t':'','v':97.48},{'t':'','v':96.43},{'t':'','v':95.54},{'t':'','v':96.56},{'t':'','v':97.54},{'t':'','v':97.22},{'t':'','v':96.69},{'t':'','v':95.72},{'t':'','v':95.16},{'t':'','v':93.57},{'t':'','v':93.91},{'t':'','v':94.09},{'t':'','v':93.09},{'t':'','v':93.22},{'t':'','v':93.88},{'t':'','v':94.91},{'t':'','v':94.56},{'t':'','v':94.83},{'t':'dec','v':95.33},{'t':'','v':95.01},{'t':'','v':95.05},{'t':'','v':95.00},{'t':'','v':94.88},{'t':'','v':94.68},{'t':'','v':94.82},{'t':'','v':94.51},{'t':'','v':94.74},{'t':'','v':94.13},{'t':'','v':94.76},{'t':'','v':93.63},{'t':'','v':93.09},{'t':'','v':94.05},{'t':'','v':94.49},{'t':'','v':94.38},{'t':'','v':94.28},{'t':'','v':93.53},{'t':'','v':94.80},{'t':'','v':95.24},{'t':'','v':95.03},{'t':'jan','v':96.85},{'t':'','v':98.58},{'t':'','v':99.20},{'t':'','v':98.04},{'t':'','v':96.62},{'t':'','v':98.95},{'t':'','v':99.43},{'t':'','v':99.74},{'t':'','v':99.67},{'t':'','v':101.16},{'t':'','v':101.00},{'t':'','v':99.30},{'t':'','v':99.18},{'t':'','v':99.60},{'t':'','v':100.06},{'t':'','v':99.99},{'t':'','v':99.90},{'t':'','v':100.20},{'t':'','v':99.85},{'t':'','v':99.67},{'t':'','v':100.20},{'t':'feb','v':100.94},{'t':'','v':99.36},{'t':'','v':99.32},{'t':'','v':98.59},{'t':'','v':99.59},{'t':'','v':100.00},{'t':'','v':100.48},{'t':'','v':100.92},{'t':'','v':98.83},{'t':'','v':99.48},{'t':'','v':99.42},{'t':'','v':99.64},{'t':'','v':101.10},{'t':'','v':100.98},{'t':'','v':101.90},{'t':'','v':101.86},{'t':'','v':102.42},{'t':'','v':103.36},{'t':'','v':102.52},{'t':'','v':102.92},{'t':'mrt','v':101.86},{'t':'','v':99.26},{'t':'','v':100.24},{'t':'','v':99.68},{'t':'','v':98.12},{'t':'','v':98.63},{'t':'','v':100.46},{'t':'','v':100.24},{'t':'','v':100.10},{'t':'','v':100.38},{'t':'','v':100.96},{'t':'','v':101.56},{'t':'','v':100.32},{'t':'','v':98.03},{'t':'','v':96.49},{'t':'','v':97.03},{'t':'','v':97.70},{'t':'','v':98.27},{'t':'','v':97.25},{'t':'','v':96.31},{'t':'','v':96.48},{'t':'','v':96.01},{'t':'apr','v':97.88},{'t':'','v':97.76},{'t':'','v':97.33},{'t':'','v':100.50},{'t':'','v':100.62},{'t':'','v':101.18},{'t':'','v':101.46},{'t':'','v':102.24},{'t':'','v':101.76},{'t':'','v':102.06},{'t':'','v':102.78},{'t':'','v':102.72},{'t':'','v':102.44},{'t':'','v':102.52},{'t':'','v':101.94},{'t':'','v':102.62},{'t':'','v':101.50},{'t':'','v':100.74},{'t':'','v':100.24},{'t':'','v':102.02},{'t':'mei','v':101.06},{'t':'','v':102.00},{'t':'','v':103.74},{'t':'','v':102.64},{'t':'','v':102.40},{'t':'','v':102.28},{'t':'','v':100.84},{'t':'','v':101.72},{'t':'','v':103.06},{'t':'','v':101.92},{'t':'','v':102.46},{'t':'','v':102.80},{'t':'','v':104.32},{'t':'','v':104.66},{'t':'','v':105.62},{'t':'','v':106.60},{'t':'','v':105.62},{'t':'','v':105.32},{'t':'','v':104.96},{'t':'','v':104.70},{'t':'jun','v':104.98},{'t':'','v':106.18},{'t':'','v':104.98},{'t':'','v':105.20},{'t':'','v':104.70},{'t':'','v':105.06},{'t':'','v':105.20},{'t':'','v':105.76},{'t':'','v':106.90},{'t':'','v':108.70},{'t':'','v':108.14},{'t':'','v':107.56},{'t':'','v':108.78},{'t':'','v':108.72},{'t':'','v':108.38},{'t':'','v':109.00},{'t':'','v':107.10},{'t':'','v':107.16},{'t':'','v':107.32},{'t':'','v':106.60},{'t':'','v':107.12},{'t':'','v':108.56},{'t':'jul','v':107.88},{'t':'','v':107.80},{'t':'','v':108.88},{'t':'','v':108.74},{'t':'','v':108.42},{'t':'','v':108.14},{'t':'','v':108.86},{'t':'','v':109.02},{'t':'','v':109.10},{'t':'','v':109.52},{'t':'','v':110.30},{'t':'','v':109.62}]

Result:


Some graph settings:

EDIT: Please place the optimization of the (smart) intervals of the chart y-axis a bit higher on the priority list.