Thanks!
What do I do now? Post this every month? So it gets mentioned as an often requested feature and it can be added? ![]()
And it seems weird that I am the only one who wants this from Homey. It seems pretty straight forward: just aggregate the data per time interval and display it in a bar. Relatively easy if you are owner of the source code.
The only thing that I can think of that is getting in the way is, the fact that Homey already has some aggregation applied. Because no one is looking for 6 year old data on 1 minute interval detail level.
With Homey Energy being an important pilar end storage getting cheaper and cheaper, perhaps it is time to rethink that strategy?
Question for the next podcast:
Will device grouping receive extended support in the future, both in device types/capabilities and functionality? For example, regarding functionality: I have two lights grouped, but the grouped flow cards for dimming don’t support a duration, whereas the individual lights do.
And to continue questions for grouping:
Once a device is in a group, it can’t be connected to another group anymore. This would be handy though…
Example: I have a fixture with a couple of bulbs. When I group those to (i.e.) “dining table light”, I cannot group them to “dining room lights” anymore.
This way I cannot operate the “dining table light” and “dining room lights” separately….
Since I switched to Tibber I have been looking a little bit more into the Energy tab. And the graphs for electricity and gas offtake below are exactly what I would like to see.

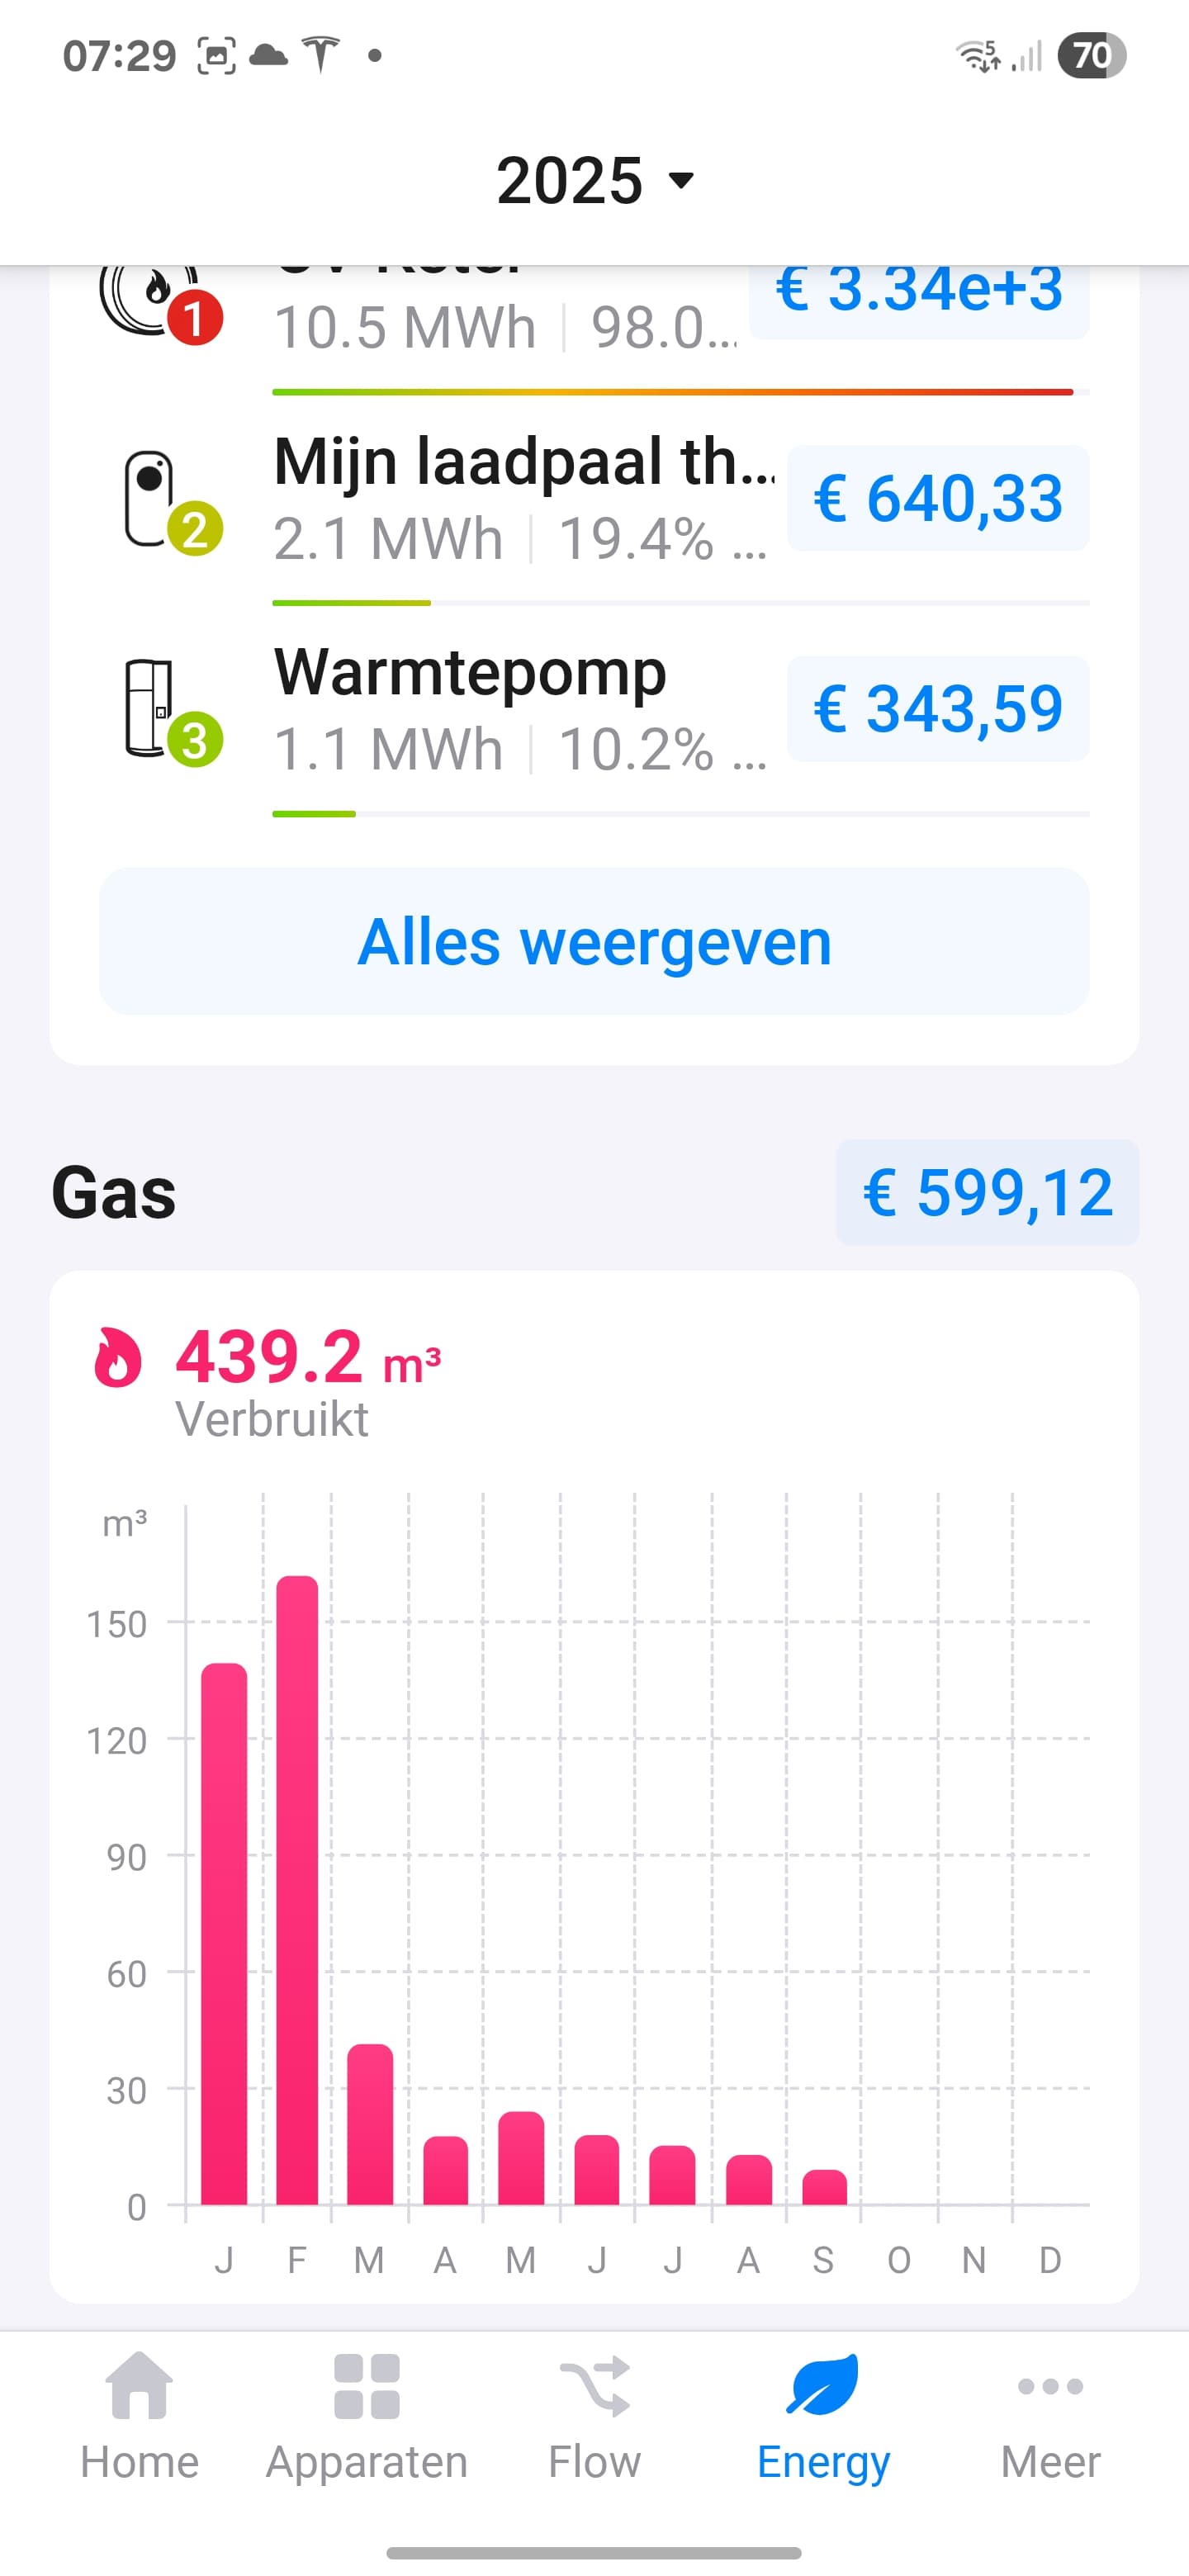
Whereas currently on device level I see the following;

So, it looks like it is possible to display graphs like these. It just needs to be implemented on device level as well ![]()
Edit: and of course it would also be very nice if the Energy tab can also come to the web interface!
New Homey Podcast (#12) available with topics:
Introduction
Our week in smart home
New Homey Apps
Looking back at 2025
OTA (device) updates
Homey Self-Hosted Server
Python support for Homey Apps
Looking ahead at 2026

Just heard the latest pod and the comment on «Z-Wave is not a future proof protocol» and in the future most/all protocols will consolidate.
Can you share more details on this, for someone who is not too up to date. Do I buy matter-ready devices, or devices that focus on wifi/LAN?
If you look at how the different technologies are being adopted you just simply see way less Z-Wave devices being made compared to for example Matter. Besides that Matter of course has the backing of large names in the industry which always helps.
Hi,
I’m enjoying your podcast, very nice.
Could you please clarify when Critical Alert is automatically triggered? I haven’t found this information in the support documentation. I’ve created some flows to send critical alerts for smoke detector events but the podcast suggests it’s unnecessary because some devices automatically trigger it.
Thanks and have a lovely holiday season.
Once again, I’m blown away by your latest product evolution—what an impressive list of releases! I especially love the SHS concept; the vision of a software-driven future that still offers seamless support through Homey Pro and Bridge hardware is brilliant. Your openness shows that we can really count on you to provide a top-tier OS for home automation, making it easier to rely on Wi-Fi and (third party) Thread as the industry transitions away from older Zigbee and Z-Wave setups.
as the future proof protocols are matter (over thread), then it seems that for running thread, you need a pro 23 pro 26 or mini. the bridge cannot support thread (radio), so the homey cloud -with its limited app support - is getting end of life then.
the shs has variants where you can link a certain sonos dongle as thread radio, but that is at the moment not supported.
i run shs in hyper-v, so no usb support, so no thread radio possible. i could use a mini as a ‘bridge’ but that is a costly option.
Thread: In theory any thread border router will work with SHS. And it is easy to see if you have one (on an Android phone: Settings/Google/All Services/Thread networks)![]()
I discovered that in my house I have many: Google TV Streamers, Google Nest hubs, Google Nest hub Max (Nest Wifi Pro or Nest Wifi router will also be great). But others may have an Apple HomePod, Apple TV or the like.
Matter: I have limited experience with actually using thread devices, but I did share all my Homey devices through the Matter Bridge app which exposes them to my Google Home.
It works through a local connection to the primary Google Nets hub/speaker: so far flawless and faster (near-instant) than the Works with Google sync with Google Assistant (which requires that Homey cloud talks to Google cloud and requires internet).
It is amazing how well it seems to work: Each time I disconnect the primary TBR, another Google device becomes primary.
Key Takeaways from my Gemini search:
-
Prioritize one primary TBR: If you want a truly unified Thread network, it’s often best to let one strong, centrally located Border Router establish the main Thread network.
-
Check for Thread 1.4 (and beyond) updates: The Thread Group is actively working to standardize how Border Routers from different vendors share credentials to form a single, more robust network. Look for updates to Homey, Apple, and Google devices that specifically mention Thread 1.4 or improved Border Router interoperability.
-
Matter is the bridge: Matter is the protocol that allows devices and controllers from different ecosystems to communicate, even if their underlying Thread networks aren’t fully merged.
-
Not all Thread devices are equal: Some Thread devices are just “end devices” (like a sensor), while others can be “routers” (relay messages) or “border routers” (connect to Wi-Fi/Ethernet). The role a Google/Apple device plays will depend on its specific capabilities and firmware.
In short, while Homey Pro can be your main Thread Border Router, don’t expect Google and Apple TBRs to automatically join Homey’s Thread network as full-fledged routers in the same way they would join another Apple/Google Thread network. However, thanks to Matter’s multi-admin feature, you can still control the same Matter-over-Thread devices from Homey, Apple Home, and Google Home.
Hi there. I’m pretty new to Homey Pro and not sure whether this would e the correct chat to post ideas to focuses in the podcast?
thanks
No reaction to the latest podcast yet? I watched it yesterday and I love the fact that Zone sorting has been released today. Finally can get rid of those numbers for the Zone names. ![]()
Ok people, @Abe would really like to get 10.000 likes on the new podcast, please go there and give it a thumbs up! ![]()

I get the impression that @Doekse wouldn’t mind a few less likes… ![]()

3 Likes
I did not get the comment about the pairing between SHS and Homey Pro and I am a bit disappointed to be honest. Most of the people purchased their Homey Pro BEFORE SHS got introduced and are maybe not willing to buy the new Homey Pro 2026. With SHS it would have way more RAM and CPU than the Homey Pro so having your flows and apps running on SHS while your devices are connected in your Homey Pro as a bridge is not a bad idea in my opinion. And let us choose whether we want to waste money or not, it’s our problem ![]() Thank you.
Thank you.
Well, I can understand Emile saying that he can’t see people buying a Homey pro to extend their SHS when Homey Bridge offers the same functionality at a much better price point. But in that statement he’s ignoring the users that build their SHS while already owning a Homey Pro.
I have no idea about the number of users who went that route, but Athom has these numbers so it may be ignored deliberately.
But it doesn’t, though. And for that reason I’m not going to buy a Homey Bridge. It doesn’t support Thread, and it has an old and worse performing Zigbee chip.
