Used card:

Homey (the low line is a negative value):

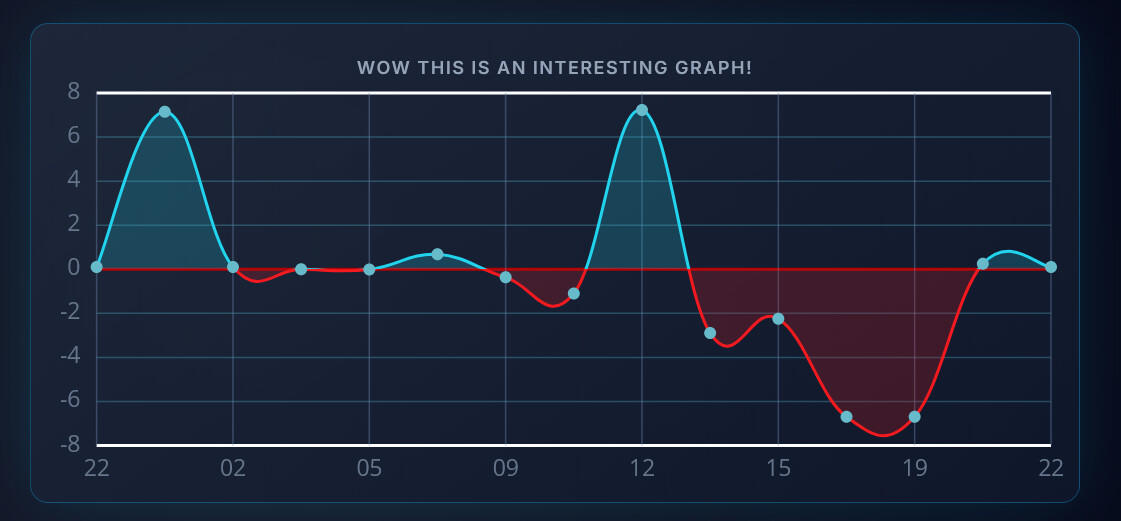
Dashboard Studio:

See the peak value around 11.
Used card:
Hi , @Satoer, thanks for the many adjustments. I am trying the new possibilities of the button but the icon still responds to the length of the text. If the text is short, the icon moves to the right. I had expected the icon to stay on the left regardless of the length of the text.
After some experimenting I have deployed the first version of the dashboard for personell of our health club. I have to say great work @Satoer! Maybe in the future I will replace my (high maintenance) HA floor plan dashboard at home. ![]()
Hi All,
I’ve finally finished the security update. If you want to access your dashboards from outside your local network, I highly recommend turning on the Security Token in the settings.
Please note that if you do want outside access, you will need to open up the port (default 5050) to your Homey IP in your router settings.
To get into the dashboard, you’ll need to add this token to the URL, otherwise access will be denied.
http://[Homey IP]:5050/?token=uYDLtroQXPO8tZjuoPL0
This is enforced on the server side. Just a heads-up: once this is enabled, the website won’t be accessible without a token locally either.
Fixed some problems also:
Fixed the issue where time was shifting in the graphs.
This was already available in the first version, But it is over here (moved it in a better location in the previous version):
Everything is cached in the Homey part of the app so the latest values load directly when a dashboard refreshes. However, if you install a new version of Dashboard Studio or restart your Homey, that cache is cleared. I added the functionality that in those cases, the software will try to read all enabled device capabilities. It doesn’t read data sent from graphs or “then” cards though, so those will only update when new data comes through.
You can now set the font of the value and unit (Label & Text section):
When you load a new dashboard, those URL parameters are now removed automatically.
The icon browser now loads (all) icons dynamically as you scroll.
Added a new ‘Button Alignment’ setting to the Switch/Button widget:
Check out the full change-log on:
Happy dashboarding ![]()
Wow… that looks awesome Martijn. Nice design.
I used I variable (0 / 1) in Homey to show or hide an dashboard element with widget info - vis.
Today I thought this was easier to understand by using a boolean (no/yes), but found out this does not work, Does Dashboard Studio indeed only work with a 0 (off) and 1 (on) input for vis? Or am I doing something wrong?
You need to use true or false (But I thought 0 an 1 should work also, but I have to check this)
Ok, my bad. Indeed, I am using true and false. However I changed from using a global homey variable to a property of a device. That did not work anymore, but need to investigate better to determine if it’s me or something else ![]()
As far as I see I am not doing this wrong.
What works to show/hide a widget is using a homey variable:
What does not work is using a boolean field in a device created in Homey with device capabilites:
In the first case the widget is shown and hidden as expected.
In the second case the widget is always hidden, although the boolean is true (see snapshot).
And another thing: when having fields with long names I cannot see the complete fieldnames in the pulldown menu and I cannot scroll sideways nor see the full name when hovering over it with the mouse pointer. This makes it difficult to pick the rifht one, might be a nice one to fix in the future.
@fmb: I am not sure what steps you are missing. But let me create a short tutorial for you how to change the visibility of widgets based on boolean variables.
First create the boolean (Yes/No) variable:
Then create a flow that changes this variable:
After that go to the Dashboard Studio settings in Homey and activate the capability of this Variable. The variable is listed just like the devices in the “Zone” “Variables”:
Only capabilities that are activated here are send to Dashboard studio
Now go to the Dashboard Studio editor in another browser window and open up the “Data Stream Explorer” (Make sure “Dashboard Settings” is selected in the “Selected Widget” dropdown, if not click anywhere on the empty dashboard canvas). On the left the Homey flow in a separate browser window. When you flip the variable by pressing the play button, you should see the data of it in the data stream explorer:
Now click the widget you would like to hide based on this variable, in the Widget info, there is a VIS setting (I am going to rename this to Visibility in later versions). Click the smal chainlink icon (1) to make this value dynamic. After that the edit box below it changes in a dropdown box (2). Here type in the Boolean name (in my case “ButtonTest”) and you should be able to select it.
press enter and now the widget should disappear and reappear when the boolean is changed.
Pro tip:
You do not have to use variables to change elements like these. There is a more direct way by using the dashboard studios “THEN” card:
Just make up a unique “event name”, set the value to true or false, and fill in the the “event name” in the Dashboard Studios dynamic dropdown box to control the state directly from a flow.
@Satoer Wow, you are fast! Thank you for the updates.
I don’t mean number of decimals in the y-values (but could have some use cases as well), but rounded values (hundreds or thousands) on the y-axis like the second graph below :
Dashboard Studio (look at y-axis values)
Quickchart graph (look at y-axis); that’s what I mean with rounded values, e.g. add 5% to highest and subtract 5% from lowest value, and define the corresponding rounded y-values dynamically:
EDIT:
Great updates!! Love the way you implemented the security-update. You can just ‘include’ it in the URL for indoor use, but for ‘public’ access you configure the domain pointing to your IP without it so you get the password pop-up…
One more question, for now. Is there a way to get rid of the shadow line on the right side when using a completely white (e-ink) background? I thought it might be a kind of glow but don’t find it in the settings for the canvas…
Keep up the great work!
Thanks. If the token is wrong or missing in the URL, the password popup always shows. Once entered, it adds the token to the URL.
I think adding a token to the URL is the best balance between convenience and security. I suspect a lot of dashboards are running on wall-mounted tablets just to show information, without any keyboard attached. It would be quite annoying if after a short Wi-Fi drop or a reboot, the user has to attach a keyboard just to log in again.
It does leave a slight security risk, though. Because a direct connection to a home IP is usually unencrypted (HTTP), someone doing a man-in-the-middle attack could read the token out of the plain-text URL if a user decides to open a port on their router to the internet. So if you want absolute security when accessing the dashboard from outside your home, I suggest using a VPN instead of opening a port.
You mean the shadow that shows the boundaries outside the working canvas?
@Satoer Hi, concerning the shadow, I mean the shadow on the right of the canvas which is visible on mobile & tablet. Strange enough it’s not visible on computer
Ah, I know what this is, it is the shadow of the help file panel that hides away on the right side. ![]()
Never noticed it myself. It is an easy fix. Shall implement this in the next version. ![]()
Is there also a possability to build in a versioning on the dashboad file/ canvas.
I think I’ve saved a dashboard over another dashboard, and now I can’t go back and I’ve to do it all over. I didn’t make any export ![]() .
.
Thank you, highly appreciated!
To be clear:
This is a snapshot of the device created by “Device Capabilities” including the setting to send the data to Dashboard Studio.
Update 10 minutes later:
Using the event flowcard works perfect, thanks for pointing that one out!
So no need to fix anything for me anymore concering showing and hiding widgets ![]()
If I search for solar in the icons I can’t find any, but if I change the icon text to ph-solar-panel it will work.
New version! 1.2.1
Took me way too much time figuring this out but…
Rounded values on the Y axis ![]() (Also fixed the negative fill color when the baseline is activated)
(Also fixed the negative fill color when the baseline is activated)
This setting in the “Axes & Labels” section of the graph:
Renamed all the abbreviated labels in the editor to full more descriptive properties. (so VIS is now Visible)
Fixed this also (but forgot to type it in the changelog)
Read the full changelog over here
Nice, thanks!