Bedankt! ![]()
Sure. This is an English topic though, is this a problem?
Do you have installed the “power by the hour” app? If not first install that and configure it for Tibber. After that create this flow:

This flow is retrieving the energy prices of the day. It is a json formatted list, but the graph widget inside dashboard studio understands that format.
After retrieving it sends the data to a “topic” called “EnergyPrices” (case sensitive) You can make up any name for this, as long as it is unique.
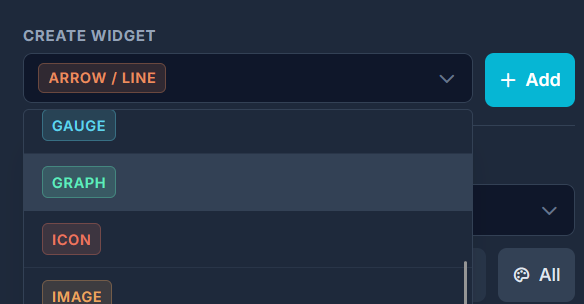
Now go to Dashboard studio open the editor and drop a graph widget on the canvas.
Then open up the data source and go to the “Data” configuration:

You have to make this data source dynamic by pressing the link icon (1). After this you can fill in the “topic” (2) With the topics you link up data sources (note: in Dashboard Studio you can make almost any value dynamic). Here you fill in the unique name you just invented.
Now go back to homey and execute the card (test from here):

This will send the energy prices to the topic, and it should show in the graph:

This is the default graph. But you can change the graph however you want. Create a bar graph, add labels, lines… :

Dashboard Studio snippet of this graph (you can import this in the editor tools in the top):
{
  "snippetHeader": "Dashboard Studio Snippet",
  "snippetType": "widget-snippet",
  "snippetFormatVersion": 1,
  "version": "1.6.0",
  "source": {
    "dashboardName": "Example",
    "page": 1,
    "createdAt": "2026-03-31T18:08:58.502Z"
  },
  "master": {
    "currentPage": 1
  },
  "widgets": {
    "graph_9390": {
      "type": "graph",
      "overrides": {
        "x": 280,
        "y": 200,
        "width": 480,
        "height": 240,
        "zIndex": 10,
        "page": 1,
        "data": "15,20,10,100,94,12.5,23,97,30,10",
        "min": 0,
        "max": 100,
        "autoMin": true,
        "autoMax": true,
        "label": "Energy Prices",
        "metaName": "Energy Prices Graph",
        "type": "bar",
        "showAxisX": true,
        "showAxisY": true,
        "axisResX": 2,
        "decimals": 2,
        "labelBold": false,
        "axisFontBold": true,
        "gridHTopShow": true,
        "gridHBotShow": true,
        "gridHBotCol": "#ffffff",
        "gridHTopCol": "#ffffff",
        "gridHInnerShow": true,
        "gridHInnerCol": "#ffffff",
        "gridHInnerOp": 20,
        "roundingMode": "exact",
        "axisResY": 5
      },
      "bindings": {
        "data": "EnergyPrices"
      }
    }
  }
}


