Sure! I want to be able to show weather data from online sources. I found a nice one, that output SVG. If that would be supported, you could use this:

More info: Yr - Roermond - Graph
Sure! I want to be able to show weather data from online sources. I found a nice one, that output SVG. If that would be supported, you could use this:
More info: Yr - Roermond - Graph
Haha, I haven’t heard much from them. Only a question about whether I’d considered a security system; since it was already on my roadmap, I went ahead and implemented it. They won’t be jealous. If I were Athom, I would also implement a rigid, foolproof and simple dashboard system, it aligns with their overall philosophy. Tested apps, dedicated widgets, and no complex logic required.
To be fair, I’m actually surprised by how many users have picked up Dashboard Studio so quickly. It’s not that complicated to attach properties to dynamic values, but the sheer amount of adjustability can definitely be overwhelming for a beginner. Anyhow, I’m just glad I could transform my project into a highly customizable dashboard alternative for everyone.
I have plans to make it more user-friendly, like adding widget presets and video tutorials… but everything takes time ![]()
Wow, I have never seen a weather graph like that with all the icons! ![]()
Is this something you’re looking to create? I’m curious how you’d approach this using an image widget with SVG support. Looking at it, I think it’s doable in Dashboard Studio, though it would probably require some pretty clever scripting to pull off. This is no beginner stuff. ![]()
See my post 146 about SVG. Integration with Homey data (variables and json arrays) to draw graphs needed.
But would you like to have some kind of edit box where you can paste (or connect and send dynamically) svg data, or just as Rob_G want the image widget to be compatible with an url pointing to an svg file?
This type of flexible software will differ from original video in no time. I think the documentation you have now will be informative and manageable in less time with more accuracy.
Anybody interested in showing Buienradar rain forcast in a graph? I figured it out.
A svg image with an url reference is already available with external icons.
Advanced graphs with svg and Homey data is what I mean, could be done with a line editor. Question is: how to integrate svg with Homey data?
Make an additional reference to an existing container for each component. The condition is that all components are located within the coordinates of the container. If the container moves a number of x or y positions, the related components are moved by the same amount. This can already be used to a limited extent by manually selecting several components at the same time.
@Satoer A question: can I send JSON formatted data like “Send Insights”, also manually to a widget?
I just fetched rain forecast data from the web and I converted it to this:
It works when I convert it to a Graph widget. However, if I switch on the y-axis, I get an error:
Toggling it a few times, will crash Dashboard Studio completely…
This is the array I’m sending:
[{“t”:“2026-03-11T20:25:00Z”,“v”:0},{“t”:“2026-03-11T20:30:00Z”,“v”:0},{“t”:“2026-03-11T20:35:00Z”,“v”:0},{“t”:“2026-03-11T20:40:00Z”,“v”:0},{“t”:“2026-03-11T20:45:00Z”,“v”:0},{“t”:“2026-03-11T20:50:00Z”,“v”:0},{“t”:“2026-03-11T20:55:00Z”,“v”:0},{“t”:“2026-03-11T21:00:00Z”,“v”:0},{“t”:“2026-03-11T21:05:00Z”,“v”:0},{“t”:“2026-03-11T21:10:00Z”,“v”:0},{“t”:“2026-03-11T21:15:00Z”,“v”:0},{“t”:“2026-03-11T21:20:00Z”,“v”:0},{“t”:“2026-03-11T21:25:00Z”,“v”:0},{“t”:“2026-03-11T21:30:00Z”,“v”:0},{“t”:“2026-03-11T21:35:00Z”,“v”:0},{“t”:“2026-03-11T21:40:00Z”,“v”:0},{“t”:“2026-03-11T21:45:00Z”,“v”:0},{“t”:“2026-03-11T21:50:00Z”,“v”:0},{“t”:“2026-03-11T21:55:00Z”,“v”:0},{“t”:“2026-03-11T22:00:00Z”,“v”:0},{“t”:“2026-03-11T22:05:00Z”,“v”:0},{“t”:“2026-03-11T22:10:00Z”,“v”:0},{“t”:“2026-03-11T22:15:00Z”,“v”:0},{“t”:“2026-03-11T22:20:00Z”,“v”:0}]
Nice!
The " quotes are messing with the internal javascript logic. You need to use regular “straight” quotes like this:
[{"t":"2026-03-11T20:25:00Z","v":0},{"t":"2026-03-11T20:30:00Z","v":0},{"t":"2026-03-11T20:35:00Z","v":0},{"t":"2026-03-11T20:40:00Z","v":0},{"t":"2026-03-11T20:45:00Z","v":0},{"t":"2026-03-11T20:50:00Z","v":0},{"t":"2026-03-11T20:55:00Z","v":0},{"t":"2026-03-11T21:00:00Z","v":0},{"t":"2026-03-11T21:05:00Z","v":0},{"t":"2026-03-11T21:10:00Z","v":0},{"t":"2026-03-11T21:15:00Z","v":0},{"t":"2026-03-11T21:20:00Z","v":0},{"t":"2026-03-11T21:25:00Z","v":0},{"t":"2026-03-11T21:30:00Z","v":0},{"t":"2026-03-11T21:35:00Z","v":0},{"t":"2026-03-11T21:40:00Z","v":0},{"t":"2026-03-11T21:45:00Z","v":0},{"t":"2026-03-11T21:50:00Z","v":0},{"t":"2026-03-11T21:55:00Z","v":0},{"t":"2026-03-11T22:00:00Z","v":0},{"t":"2026-03-11T22:05:00Z","v":0},{"t":"2026-03-11T22:10:00Z","v":0},{"t":"2026-03-11T22:15:00Z","v":0},{"t":"2026-03-11T22:20:00Z","v":0}]
Funny thing… I was testing this corrected code and couldn’t find out why it flatlined. Turns out that al the data is actually “0” ![]()
haha, yes indeed. Sorry for that. It doesn’t rain, that’s why….
OK, I’ll give it a go!
Actually, the original quotes look ok. I think it changed when I posted it.
This is what my inspection console says:
widget-base.js:613 Widget graph_3162 crashed: RangeError: Invalid array length
at Array.push (<anonymous>)
at GraphWidget._renderSpecific (graph.js:975:66)
at GraphWidget.render (widget-base.js:610:18)
at dashboard.js:1719:23
at Array.forEach (<anonymous>)
at HomeyDriver.onMessageCallback (dashboard.js:1716:41)
at HomeyDriver.dispatchMessage (data-driver-base.js:89:42)
at Socket.<anonymous> (homey.js:292:18)
at Socket.<anonymous> (index.js:136:20)
at Socket.emitEvent (socket.js:552:20)
Is it because I send a data format that should be used by a Send Insight card? If so, is it possible to send extra metadata to mimic the sender being Insight?
Weird. What happens if you dump that json data directly into a “Data (String/JSON)” edit box (so not connected to a topic)
No, this should not make a difference. You can see exactly the data what an Insight card sends if you look in the Data Stream Explorer. The { } copies the data. Paste it in nodepad and you can investigate it. When I tried the corrected data it worked fine.
It Looks ok to me:
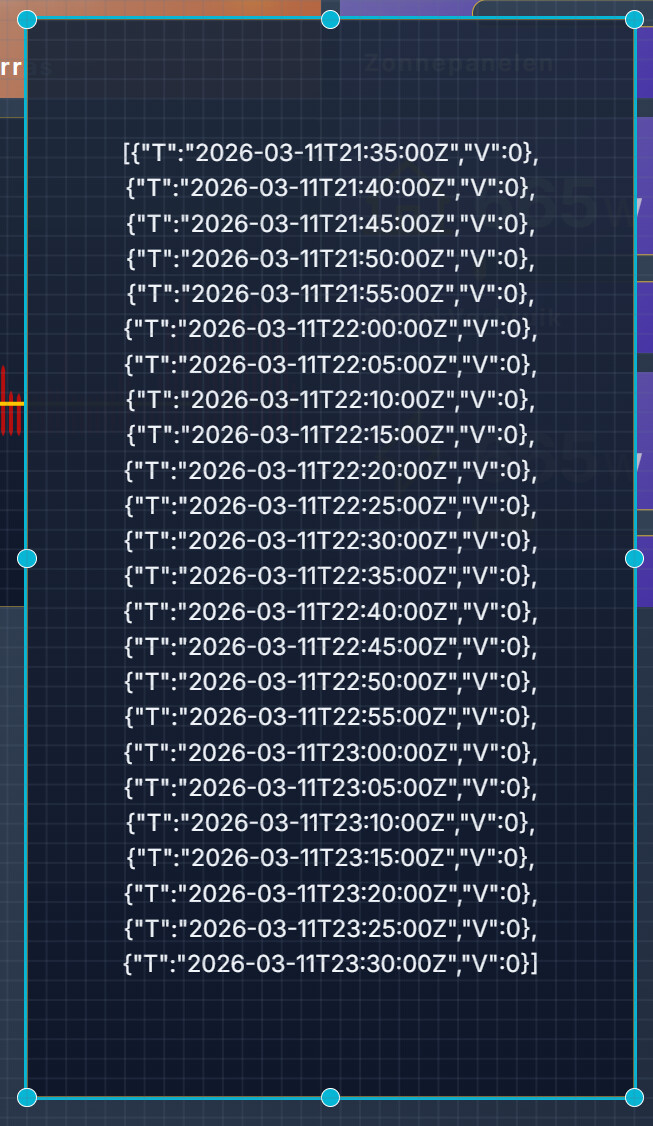
THis is the explorer:
[{“t”:“2026-03-11T21:35:00Z”,“v”:0},{“t”:“2026-03-11T21:40:00Z”,“v”:0},{“t”:“2026-03-11T21:45:00Z”,“v”:0},{“t”:“2026-03-11T21:50:00Z”,“v”:0},{“t”:“2026-03-11T21:55:00Z”,“v”:0},{“t”:“2026-03-11T22:00:00Z”,“v”:0},{“t”:“2026-03-11T22:05:00Z”,“v”:0},{“t”:“2026-03-11T22:10:00Z”,“v”:0},{“t”:“2026-03-11T22:15:00Z”,“v”:0},{“t”:“2026-03-11T22:20:00Z”,“v”:0},{“t”:“2026-03-11T22:25:00Z”,“v”:0},{“t”:“2026-03-11T22:30:00Z”,“v”:0},{“t”:“2026-03-11T22:35:00Z”,“v”:0},{“t”:“2026-03-11T22:40:00Z”,“v”:0},{“t”:“2026-03-11T22:45:00Z”,“v”:0},{“t”:“2026-03-11T22:50:00Z”,“v”:0},{“t”:“2026-03-11T22:55:00Z”,“v”:0},{“t”:“2026-03-11T23:00:00Z”,“v”:0},{“t”:“2026-03-11T23:05:00Z”,“v”:0},{“t”:“2026-03-11T23:10:00Z”,“v”:0},{“t”:“2026-03-11T23:15:00Z”,“v”:0},{“t”:“2026-03-11T23:20:00Z”,“v”:0},{“t”:“2026-03-11T23:25:00Z”,“v”:0},{“t”:“2026-03-11T23:30:00Z”,“v”:0}]
This is when I link it to a text box:
(the text box put everything in UPPERCASE)
@Satoer I think I found it. It happens when all values are 0 (zero).
The problem is the Auto MAx setting. When that is on, and all Y values are 0, then the widget crashes. Wen auto max is off, or there is at least one non-zero value, then it is ok.
Oh shit, nice debugging Rob. Thanks.
I can recreate the problem over here.
I will solve this problem in the next version.
Great news!
Looking forward to all future developments and nice things on the todo list.