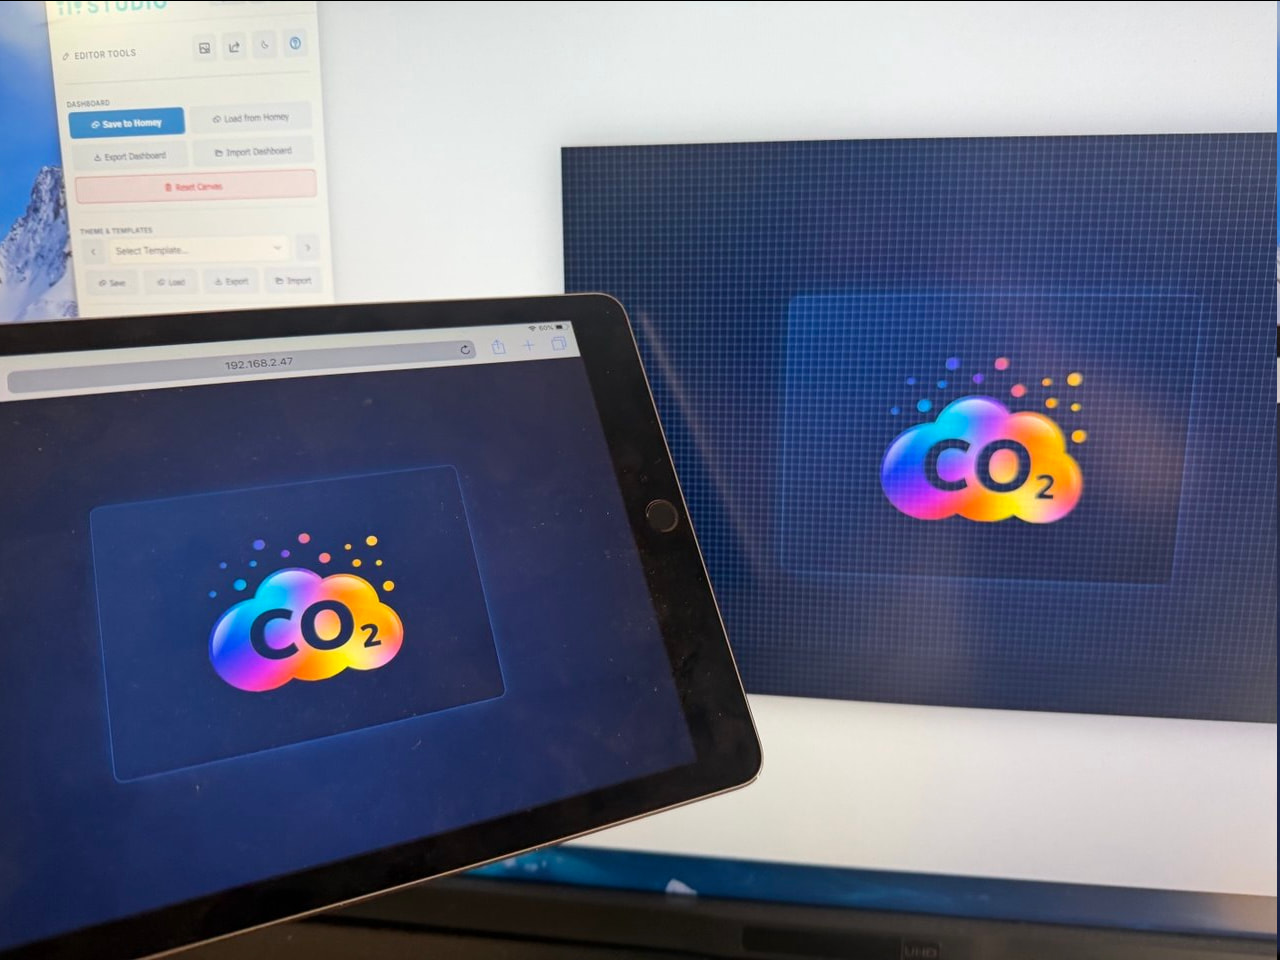
Other one: showing preferred Sonos radio stations with a Homey script Sonos api. Send the station logos in one SVG to the dash. Use a hidden button to start playing the selected radio station.
The text widgets now do show on the old iPad. Great work. Thanks,
The *.png’s in the icons still show as a few pixels. Did you check as an icon and put a .png in it?
If I use a image widget (not an icon widget) then the .png images do show just fine.
Hi Amersfoort, I now have a script that retrieves the image URL from my Sonos IP. The script writes these images to 12 text variables. The text variables are linked to buttons in DS. When I press a button, I start a script that populates 1 variable with the URI. This is a new option in the Sonos app. Play URI and that works well. Now I can simply select 12 new favorites in the Sonos app.
Thank you @Johan_Huisman for your information.
In the Sonos Local api you can see my request about this subject.
I made this with a SVG already before the Play uri functionality became available. Because of the big related flows I made the “request”. For me the advantages where:
dynamically select Sonos favourites (nothing to change on Homey when changing Sonos settings)
create all image buttons in one SVG
send SVG to dashboard
send the uri favourites to 18 hidden buttons
selecting a button in the dash sends the uri to the Sonos uri card
Advantage: one script needed without Homey maintenance. Disadvantage: SVG needed (but Gemini AI is most of the times a great help).
It probably was something I wrongly configured.
I created a new canvas, as you suggested, and added a new icon widget.
The image size of the *.png shows OK on the old iPad.
For me all is ok now. Thank you for all your effort and sorry I had misconfigured the icon and thought it was a dashboard issue.
I tested the data and it looked perfectly fine until I actually added an offset. It pushes the text right out of the table boundaries. Because of that, I should disable the offset settings for text inside tables. Offset is meant more for tweaking text positioning when it is used with buttons, sliders, or gauges. The typography slide-out is just a uniform section used across multiple widgets.
It is not really a bug. You can also position text outside the boundaries of a button, for example. Trying to hard-code a way to prevent users from doing this in specific scenarios would just add unnecessary complexity.
Why do you even need the offset here? Are “Vertical Spacing” and “Line Height” not enough to position the text?
These won’t do the job. You can see the result of the offset 0 in the image from yesterday. A vertical spacing of 60 looks awful and takes up too much space.
Alternative: defining a Markdown table without Header 3 and manually define a label on top of the markdown table.
Something else: I have a few questions regarding an Edit box (first time use):
I can see multiple border settings 2 times. What is the difference?
I would like to save some monthly data of my solar panels
On top of the Markdown table I defined some Edit boxes. After filling in a box and leaving the focus, I would like to use the values of the whole line and calculate the non editable fields with a flow/script. How can I use all values of the Edit boxes in that line in a smart way?
Ah, I think I understand what you mean. The gap between “Toelichting en waarschuwingen” and “Samenvatting” is way too big?. Looking closely at your table, those headers are completely empty, yet they are still hogging screen real estate.
I think you can bend this to your will. Check out the example above. The top one is a standard table where I turned the border red just to show what we are dealing with. The bottom one is a tweaked version with the full content, where I messed around with the Table Cell Padding and shrank the Header 3 typography Vertical Spacing and Line Height. Does that look closer to what you have in mind?
Also, I could probably add some code to completely hide the header if it is left totally empty. Would that fix the spacing issue for you?
Yeah, that is a bug. You are supposed to be able to tweak the container border and the edit box border separately, but it looks like I accidentally linked them together in the code
Just a heads-up on how the edit box behaves: it actually fires its data over to the configured “Output Topic” only when you hit Enter, rather than when you lose focus. Once you hit Enter, that data goes straight to the output topic / Homey, where you can intercept it and work your magic.
I am not entirely sure how the table data gets generated on your end, but once Homey gets those edit box values, you should be able to recalculate the whole table and push the updated version back.
Note: You can also force the edit box to send its data by triggering a topic via the “Trigger Topic” setting, which means you could easily hook this up to a “Submit” or “Calculate” button.
Honestly, hats off to you for the incredible dedication here. Building a full payback period calculator like this is next level. At first, I had you pinned as a meteorologist with all the weather data, but now I am convinced you are secretly a financial accountant or something!
(I have also read your other messages, but I do not have the time to reply on everything right now )
Discovered the app this morning. I have not moved from my laptop all day configuring my new dashboard. This should be an official dashboard app.
I am stuck on 2 things. I have Frient electricity meter. It is showing all the stats on energy tab in Homey. I can show current power from the grid but looking to get:
Total kwh for the day
Convert kwh to € for the day
How can I do calculations or trigger a calculations for this?
What surprised me was that not all the markdown text was visible using this intended offset. I think that could have a fix.
As a Windows user I use the Tab key to confirm the input and go the next field , not an Enter key to confirm the input.
So your advise is: first fill in all Edit boxes, push a button that triggers all boxes to send their values to a Flow.
After that I have to concatenate these variables as one input variabele for my calculate-script.
A script generates a SQL, which is the input for the MySQL card writing the record to a database table. The next script should read this database table and generate a Markdown code for the DS Markdown table.
5 years ago, I started making an app in Microsoft Powerapps to provide insight into the costs and revenues (money and energy) of my new solar panels. That is why there is still that sunny orange glow in the background of all my screens.
After purchasing a Homey 2 years later, the app has grown to control home automation and all information in and around my house.
Powerapps is a cloud application. To still achieve a semi-real-time integration with Homey, I sent all device information, including all capabilities, from Homey to my app in JSON format every 5 seconds. Due to the increasing number of used apps and home devices, my poor tablet eventually had to read 50,000 JSON lines every 5 seconds and convert them into understandable values, supported by many virtual devices. Even my fast Android tablet struggled with it more and more.
That was a reason for me to test an alternative: Dashboard Studio with MQTT and a local connection, resulting in very good performance and less stress on the tablet.
I am now in the process of transferring the final part of my own app, which I built up over a period of 5 years, to DS.
I have no experience with the Frient meter. I do use a HomeWizard meter, and this is giving me all kinds of interesting information about the power usage in the devices setting. Doesn’t the Friend sensor give this information? These are the device capabilities of my Homewizard sensor:
I could enable the “Daily usage” and attach that topic to a widget to show the total kwh of the day.
If you know the kwh of the day, you could create a simple flow to multiply it with the kwh price and send this directly in a topic to dashboard studio. Assuming you do not use dynamic tariffs? if you do have a dynamic contract, you should install the excellent app “Power by the hour”. This will calculate lots of interesting price data (also kwh usage!):
I think that is the most straightforward solution. With a single button you can trigger all edit boxes to send their data and execute the script that handles the data. I would probably put every value in a homey variable. And let the button also trigger a flow that first waits a couple of seconds (to be sure the data is copied to the variables first) and then generates the new table based on these new values. You can create Homey scripts that handles multiple variables. Interesting topic about that:
Some remarks on this:
I have not optimised dashboard studio for keyboard use. Always intended the usage with touch screens or info screens. Couple of problems that might arise: tabbing to controls are based on creation time. So you need to create the edit boxes in sequence of tabbing. Also buttons / sliders are not keyboard friendly. You can not tab to a button and press to execute it.
Might add improvements for this later (option to set tabbing order, and keyboard controls for buttons menu’s, sliders etc). But for now, you are limited to mouse / touch control.
Do you do this all on your Homey? (is there a MySQL app / server?) or do you handle this externally to a nas / server or cloud like that “Powerapps”? (Just interested, you do not have to explain in detail)
I first tried concatenating the 5 DS Edit box variables with an All condition in Advanced Flow, but that didn’t work. I think the supply line needs to be running for the All to function.
In the end, as you suggested, I first stored the DS Edit variables in Homey variables, waited 1 second, and then let the script read the variables.
I have a mini-PC as a server, running MySQL (free version) on it, among other things, and recently using the accompanying Homey app.
When I wanted to save and read 1,800 solar-related records, I had previously stored them as a Homey JSON variable (missing the PowerApps database Microsoft Dataverse). From an IT perspective, I am a functional software consultant with some technical knowledge (so you don’t have to guess anymore), I no longer consider that a good solution. MySQL runs fast on this lightweight server and has many similarities to SQLServer (which I am somewhat familiar with).
So I assume the “energy” is the total amount of energy (kwh) consumed by your home?
You can calculate a custom “Total kwh for the day” with this information.
Go to the flows and create a new advanced flow.
Create three new number variables. “kwh_start_of_day”, “kwh_today” and “energy_euro_today”
Now create a WHEN card “The time is 0:00” (Date and time section). This will execute on the start of the day. Connect this to a THEN Logic card: “Set [kwh_start_of_day] to [Electricity Meter Interface 2 / energy (the tag)]” (flowcard “Set [Number Variable] to [number]”)
This stores the current consumed kwh on the start of the day.
Now create a new WHEN card:
Something like “The Energy has changed” (of the Frient section) this will probably have a “energy” tag also. connect this to a THEN card (logic section): "Calculate [kwh_today] as [ {{energy tag - kwh_start_of_day }}] (Card: Calculate [number variable] as [text])
Now te kwh_today variable/tag should have today’s consumed energy.
Next, calculate the price of today:
connect the same “The Energy has changed” to a new THEN “Calculate [number variable] as [text]” flow card. configure it like this: Calculate [energy_euro_today] as [{{kwh_today* 0.34 ( <= The price you pay per kwh)}}])
Save the flow and go to the dashboard studio configuration in homey, scroll all the way down to the “Variables” section. Find “kwh_today” and “energy_euro_today”, an enable the “value” on them both.
Now go to the Dashboard studio editor, open the “Data stream explorer” and you should see topics "“kwh_today/value” and “energy_euro_today/value” You can use these topics inside a gauge / text / label / graph widget (or whatever you would like to use to show these values).
Note: At first usage the values in “kwh_today” and “energy_euro_today” are way to high. That’s because the 0:00 has not been passed so kwh_start_of_day is stil 0